

How to Right-Size Your Real Estate Portfolio Using Occupancy Data


VergeSense is the industry leader in providing enterprises with a true understanding of their occupancy and how their offices are actually being used.
Most corporate real estate portfolios were sized for a world that no longer exists. According to the latest VergeSense Occupancy Intelligence Index, average utilization across global portfolios holds at just 9 to 11%, with average daily peaks that consistently triple or quadruple that baseline and peak capacity reaching only 52 to 60%.
That gap between what companies pay for and what employees actually use is a structural mismatch, one that compounds across every lease, every floor, and every building in a portfolio.
This piece walks through a practical framework for using occupancy data to right-size your real estate portfolio:
- What to measure
- How to turn space-level metrics into portfolio-level decisions
- Where CRE leaders most often go wrong
Want to see how your portfolio's utilization compares to 210+ enterprises across 50 countries?
Explore the latest occupancy and utilization data in the Workplace Occupancy & Utilization Index Explorer, an interactive tool built on 250M+ sq ft of measured workplace data.
What Is Real Estate Portfolio Optimization?
Real estate portfolio optimization is the ongoing discipline of aligning your physical footprint with actual, measured space demand. Rather than treating your portfolio as a fixed input, optimization treats it as a variable you continuously adjust based on how people use space, how demand shifts, and where the next lease decision sits on the calendar.
Portfolio optimization is a continuous loop, distinct from one-time downsizing or reactive lease responses: measure utilization, identify mismatches, run predictive planning scenarios, act, and then measure again. Companies that treat it as a single project tend to over-correct once and under-correct for years afterward.
Why Right-Sizing Matters at Lease Renewal
Hybrid work broke the assumptions most portfolios were built on. Headcount-based planning, where every employee equals a seat equals a square footage allocation, doesn't hold when attendance patterns vary by team, day, and season.
Yet many organizations are approaching lease renewals on portfolios sized with pre-2020 logic, locked into commitments that reflect a different era of work.
The window for renegotiation is open now for a large share of enterprise leases. CRE leaders who can quantify the gap between their current footprint and their actual demand have a stronger position at the table. Those who can't are either overpaying for space they don't need or making cuts they'll regret.
The Cost of Getting It Wrong
Portfolio optimization errors cut both ways. Holding excess space is the more visible cost: lease obligations, utilities, maintenance, and cleaning for floors that sit largely empty. But cutting too aggressively carries its own risks.
Consolidating into a footprint that can't absorb peak demand creates crowding on the days it matters most, erodes employee experience, and can force expensive short-term fixes like temporary leases or accelerated build-outs.
The goal is to match supply to demand with enough confidence that neither outcome, the waste of over-holding or the disruption of over-cutting, becomes the default.
How Occupancy Data Changes Portfolio Decisions
For years, CRE teams made portfolio decisions using a combination of headcount projections, badge-swipe counts, and executive intuition. Those inputs are by no means useless, but they're incomplete.
Badge data tells you someone entered a building; it doesn't tell you whether they used a desk, a meeting room, or the lobby coffee bar. Booking data tells you a room was reserved; it doesn't tell you whether anyone showed up.
Occupancy data changes the decision-making surface by measuring what's actually happening in space, continuously and at a granular level.
What Occupancy Data Actually Measures
True occupancy measurement captures presence at the space level: who's in a room, a neighborhood, or a zone, and when.
Most occupancy sensors track active presence, whether someone is physically in a space at a given moment. The Infinity Area Sensor detects signs of use like personal belongings to distinguish between a space that's genuinely empty and one where someone has stepped away.
This granularity is what separates occupancy data from its proxies. Badge access data, room-booking systems, WiFi connections, and videoconferencing data each capture a slice of workplace activity. Occupancy sensors capture the full picture, including passive use that no badge tap or calendar entry records.
From Space-Level Metrics to Portfolio-Level Insight
Individual space-level data becomes powerful when you aggregate it. A single room's utilization rate is interesting. The utilization curve across an entire floor, building, campus, or portfolio is actionable.
This is where patterns emerge. For example, you could find ghost spaces, rooms and neighborhoods that are booked but unused, or allocated to teams that rarely occupy them. Or you could find shadow demand, pockets of the portfolio where employees consistently cluster because the space works better than what's been assigned.
The 9th Edition of the Occupancy Intelligence Index surfaces these patterns at scale, including shortage rates that reveal where specific space types, like enclosed collaboration rooms at 18% shortage during peak afternoon hours, consistently fall short of demand.
When this kind of data is aggregated across a portfolio, isolated observations become the basis for a structured decision framework.
A Step-by-Step Approach to Right-Sizing Your Portfolio
The framework below breaks portfolio right-sizing into four sequential steps: establishing a measurement baseline, identifying the assets with the widest gaps, modeling scenarios before committing capital, and building the financial case for leadership.
Baseline Current Utilization Across the Portfolio
Start with what you have. Measure actual occupancy across every location in your portfolio to establish a utilization baseline. Meaningful baselines require continuous measurement over months to account for seasonal variation, hybrid schedules, and team-level patterns.
The Index provides useful external reference points: average utilization of 9 to 11% and peak capacity of 52 to 60% across 210+ enterprises in 50+ countries. Your portfolio's numbers relative to these ranges tell you whether you're holding significantly more space than peers, or whether your utilization gaps are typical of the current market.
Identify Underperforming Assets
With a baseline in place, flag the buildings and floors that consistently fall below your threshold. The threshold itself is a judgment call, but it should be informed by portfolio averages rather than set arbitrarily.
Compare individual-asset utilization against your portfolio average and against the Index ranges: a building running at 6% average utilization when your portfolio average is 10% is a candidate for consolidation, sublease, or redesign.
Look at both the average and the peak: a building with low average utilization but high peak demand may need a different intervention than one that's consistently empty.
Model Scenarios Before Committing
This is where analysis becomes planning. Before committing to a consolidation, sublease, or redesign, run scenarios against projected future demand.
This is where tools like Predictive Planning add value. Rather than debating consolidation in the abstract, CRE teams can model what happens when they remove a floor, shift teams between buildings, or adjust hybrid schedules, and evaluate those scenarios against projected demand.
The tool surfaces planning metrics that quantify the impact of each scenario: how many employees would be left unseated by a proposed change, the effect on employee experience, and where risk thresholds get crossed. These outputs transform portfolio decisions from educated guesses into stress-tested plans.
Build the Business Case for Leadership
Utilization data alone rarely moves a board or a CFO. You need to translate occupancy insights into financial terms that align with how leadership evaluates capital allocation.
Frame the case around three levers: lease cost avoidance (the savings from exiting or not renewing underperforming leases), capital reallocation (redirecting build-out budgets away from underused assets), and operating-cost reduction (lower cleaning, energy, and maintenance costs for a right-sized footprint).
Each lever maps directly to measurable occupancy data, which makes the case auditable rather than aspirational.
Common Pitfalls in Portfolio Optimization
Three patterns consistently undermine portfolio optimization efforts, even when the data and the intent are sound.
Relying on Badge Data as a Proxy for Utilization
Badge data counts entries, not occupancy. An employee who badges in at 8 AM and leaves at 6 PM registers the same as one who badges in, grabs a coffee, and works from the lobby. When portfolio decisions rest on badge counts alone, you're optimizing against arrivals, not against how space is actually used.
This gap can be significant, particularly in hybrid environments where employees badge in but work from different zones than their assigned seats.
Optimizing One Building Instead of the Portfolio
It's tempting to start with the most obviously underperforming asset and optimize it in isolation. The problem is that building-level optimization can push demand into other parts of the portfolio without reducing total cost. Consolidating one floor might overload another building's collaboration spaces, creating a new shortage you didn't anticipate.
Portfolio optimization requires a portfolio-level view. Individual building decisions should be evaluated against their impact on the whole.
Ignoring Future Demand
A portfolio that's right-sized for today's utilization patterns may be wrong-sized in 18 months. Hiring plans, return-to-office policy shifts, team restructurings, and seasonal patterns all change demand. Any optimization effort that doesn't account for projected demand risks solving yesterday's problem while creating tomorrow's.
How VergeSense Supports Portfolio Optimization
VergeSense built Meridian, The Workplace AI Platform, to close the gap between occupancy data and portfolio action.
The platform's Occupancy Intelligence layer captures continuous, space-level utilization data across a portfolio, while Predictive Planning lets CRE teams model consolidation, redesign, and hybrid-schedule scenarios against that data before committing resources.
The underlying Large Spatial Model, which is trained on 250M+ sq ft of measured workplace data from 1,400+ sites across 50+ countries, powers the behavioral forecasting that makes scenario planning reliable. Rather than relying on rules-based projections, the LSM forecasts how people will actually use space under different configurations.
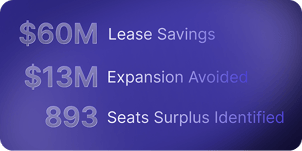
Up to $764K Per Floor in Build-Out Costs Avoided: Global BankOne global bank used Predictive Planning to evaluate build-out decisions across approximately 2 million square feet of modeled space, avoiding up to $764K per floor in unnecessary construction costs. Separately, an investment bank achieved approximately $2M per year in cleaning savings and a 30% reduction in energy costs by shifting to occupancy-driven operations. These outcomes illustrate what becomes possible when portfolio decisions run on measured data rather than assumptions. |
Putting Portfolio Optimization Into Practice
Portfolio optimization is a capability your CRE team builds and maintains.
Start by establishing a continuous utilization baseline across your portfolio. Identify the assets where the gap between capacity and demand is widest. Model scenarios before acting on them, and build a financial case that connects occupancy data to the cost levers your leadership team cares about.
The organizations that get this right don't just cut costs. They build portfolios that adapt as work patterns evolve, without the cycle of over-building and over-cutting that defines reactive real estate management.
Curious how your utilization stacks up against the market?
The VergeSense Occupancy Intelligence Index draws on measured data from 210+ enterprises across 50+ countries. See where your portfolio sits.
FAQs About Real Estate Portfolio Optimization
How Long Does It Typically Take to See Results From Portfolio Optimization?
Most organizations see actionable insights within 60 to 90 days of deploying continuous occupancy measurement. Financial results, such as lease cost avoidance or deferred build-outs, typically materialize at the next lease decision point or capital planning cycle.
What Is the Difference Between Portfolio Optimization and Space Planning?
Space planning focuses on how individual floors or buildings are configured: desk layouts, room types, neighborhood assignments. Portfolio optimization operates at a higher level, determining which buildings to keep, consolidate, sublease, or exit. The two disciplines are complementary; space-level data feeds portfolio-level decisions.
How Do You Measure Whether Portfolio Optimization Is Working?
Track utilization rates, cost per occupied seat, and the gap between portfolio capacity and actual demand over time. A successful optimization effort narrows that gap without creating new crowding or employee-experience problems at peak demand.