


CRE leaders often plan for headcount growth using HR rosters and consultant studies, tools built for a slower, less data-rich era.
Consider what happened when an Australian grocery retailer put that approach to the test: a consultant team spent weeks analyzing headcount rosters and projected an 892-desk shortfall. A workplace strategist ran the same question through Predictive Planning and reached a different answer in two hours, a 178-desk surplus, saving the company $1.5M in expansion costs per floor.
That contrast captures what corporate real estate analytics changes about portfolio decisions: speed, accuracy, and the ability to act on what's actually happening rather than what headcount models assume. CRE leaders today have more workplace data available than any previous generation. The question is whether that data is working for them or simply adding to the backlog.
This guide covers how analytics reshapes portfolio decisions across the lease lifecycle, from consolidation through ongoing optimization, and what separates teams that use data strategically from those still buried in spreadsheets.
Looking for clearer analytics to guide your portfolio decisions?
See how VergeSense helps CRE leaders turn occupancy data into confident lease and space strategies.
What Is Corporate Real Estate Analytics?
Corporate real estate analytics is the practice of collecting, integrating, and analyzing workplace data to inform portfolio and space decisions. The data sources that power it span badge access data, room-booking systems, WiFi connections, videoconferencing data, and occupancy sensors. Each captures a different layer of how buildings and spaces are actually used.
The problem most CRE teams face isn't a lack of data. Teams have access to more data than ever, but they spend too much time wrangling it at the expense of thinking through the strategic tradeoffs behind their decisions.
Hours that should go toward evaluating whether to renew a lease, consolidate two floors, or redesign a workspace get consumed by cleaning spreadsheets, reconciling conflicting data exports, and building one-off reports that go stale within weeks.
This is the core tension in CRE analytics today. The raw inputs exist. What's missing is the connective layer that turns fragmented data into a decision-ready view of the portfolio, one where CRE leaders spend their time on strategy rather than data preparation.
Why CRE Analytics Matters for Portfolio Strategy
Every major CRE decision carries financial weight that compounds over a lease term. A renewal on an underutilized building locks in years of excess cost. A consolidation based on outdated headcount assumptions can leave teams short on space within months.
Analytics connects utilization patterns to the decisions CRE leaders face: lease renewals, consolidations, headcount shifts, and design investments. When continuous data shows that a floor consistently runs at a fraction of its capacity, the renewal conversation shifts from "do we need this space?" to "how much of this space do we actually need?"
The broader shift is from reactive, spreadsheet-based planning to predictive portfolio management. Instead of commissioning periodic studies that deliver a snapshot, CRE teams with continuous analytics can monitor trends, model scenarios, and act before a lease decision is already overdue.
How to Use Analytics Across the CRE Portfolio Lifecycle
Analytics adds value at every stage of the portfolio lifecycle, not just at renewal. The sections below walk through how data-driven CRE teams approach each phase, from building the data foundation through ongoing trend monitoring.
Align Lease Timelines and Centralize Portfolio Data
The basis of any analytics-driven portfolio strategy is a centralized view of lease timelines, costs, and space inventory. Without it, teams operate in silos where regional managers make renewal decisions without visibility into how neighboring sites are performing.
Centralizing portfolio data means pulling lease expiration dates, square footage, headcount allocations, and cost-per-seat figures into a single source. This is the analytics baseline that makes every downstream decision more informed.
When a lease comes up for renewal, the team can immediately see how that building's utilization compares to the rest of the portfolio.
The goal isn't just a master spreadsheet. It's a living data environment where lease timelines, utilization data, and cost metrics update continuously rather than sitting in a static file that someone refreshes once a quarter.
Identify Consolidation and Optimization Opportunities
Once portfolio data is centralized, analytics reveals where consolidation and optimization opportunities exist. Utilization data, measured continuously rather than sampled quarterly, shows which buildings, floors, and neighborhoods are consistently underused.
Predictive modeling takes this further by letting teams test consolidation scenarios before committing. What happens to occupancy patterns if two floors merge into one? How does a headcount shift in one region affect capacity needs in another? These are answerable questions when the data is continuous and the modeling tools are in place.
The alternative is the traditional approach: commissioning a consultant study, waiting weeks for results, and receiving a static recommendation that may already reflect outdated conditions by the time it reaches the decision-maker.
Evaluate Total Cost of Occupancy
Lease cost is only one component of what a building actually costs to operate. Total cost of occupancy includes utilities, maintenance, cleaning, security, and the operational overhead of managing underutilized space.
Analytics platforms that integrate occupancy data with facilities systems can surface these hidden costs. When a floor runs at low utilization, the cleaning crew still covers every desk, and the HVAC still conditions the full footprint. Right-sizing doesn't just reduce the lease line item, but also the operational costs attached to every square foot.
CRE teams that evaluate total cost of occupancy rather than lease cost alone consistently find that the financial case for consolidation is stronger than initial estimates suggest.
Track Utilization Trends to Inform Decisions
A single utilization snapshot tells you what happened on one day. Compare that to trend data, which tells you what's actually changing over time. Are midweek peaks growing or flattening? Is a satellite office trending toward viability, or is it steadily losing relevance?
Occupancy intelligence turns trend analysis from a quarterly exercise into a continuous feed. The Workplace Occupancy & Utilization Intelligence Index, drawn from 210+ enterprise customers across 50+ countries and 1,400+ sites, provides external benchmarks that give internal trends context.
When internal data shows a building averaging 30% utilization, the natural question is: is that low relative to the portfolio, or low relative to the industry? Benchmark data answers that question and helps CRE leaders frame recommendations with confidence to executive stakeholders.
Explore how your office compares against peers in your industry and region
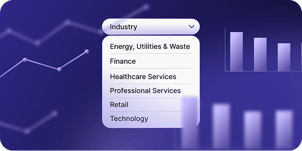
The VergeSense Index Benchmark explorer is an interactive tool built on 250M+ sq ft of measured workplace data from 210+ enterprises across 50+ countries.
How Today's CRE Teams Apply Analytics
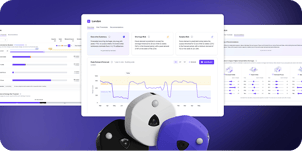
The shift from periodic studies to continuous analytics is already underway across enterprise CRE. For example, Meridian, VergeSense’s Workplace AI Platform, combines Occupancy Intelligence with Predictive Planning to give CRE teams a single environment for measuring, modeling, and acting on portfolio data.
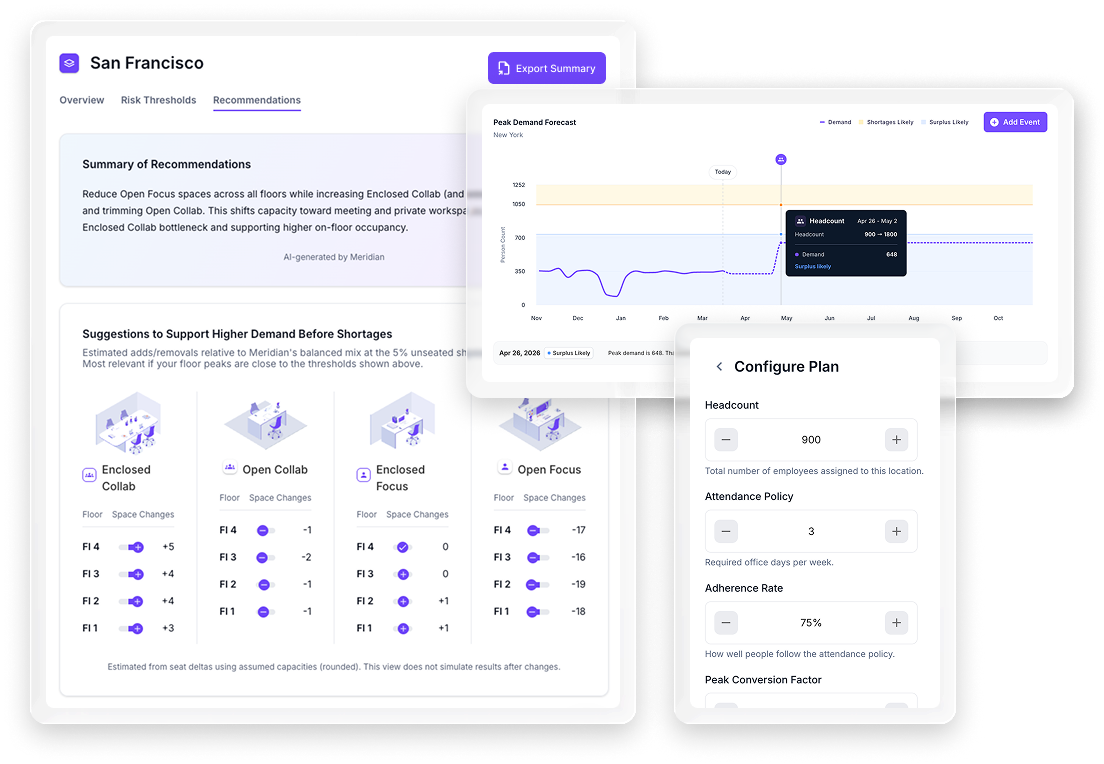
VergeSense allows you to predict how your offices will respond to projected demand and changes in design.
The Australian grocery retailer case illustrates how the mechanics work in practice. The company engaged a consultant team to assess space needs across its corporate offices. Using HR rosters and headcount projections, the consultants spent weeks building their analysis and concluded the company needed 892 additional desks, a finding that would have triggered significant expansion costs.
A single workplace strategist then ran the same question through Predictive Planning, drawing on 4.5 months of continuous occupancy data rather than roster-based assumptions. The result, delivered in roughly two hours: a 178-desk surplus, not a shortfall. Actual desk usage was far lower than what headcount figures implied.
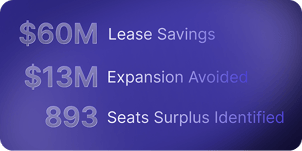
The financial impact was immediate. The retailer avoided $1.5M+ in per-floor expansion costs that the consultant's roster-based analysis would have triggered. The difference came down to what each approach could see: theoretical allocation versus measured behavior, captured continuously by occupancy sensors across the portfolio.
This pattern, where continuous data reverses or significantly revises the conclusions of assumption-based planning, is common among teams that adopt real estate portfolio analytics at scale.
Common Gaps in CRE Analytics Programs
Not every analytics program delivers equal value. The most common gaps fall into predictable patterns that CRE leaders can identify and close.
- Relying on badge data alone.
Badge swipes confirm that someone entered the building. They don't reveal where that person worked, how long they stayed, or whether the spaces allocated to them were the ones they actually used. Badge data is a useful input, but it produces an incomplete picture when treated as the primary utilization source. - Static reports instead of continuous intelligence.
A quarterly utilization report is better than no data, but it can't answer time-sensitive questions. When a lease decision needs to be made in October, a report from July already reflects outdated conditions. Continuous occupancy data closes that gap by keeping the portfolio view current. - Siloed data across regions.
Global portfolios often have different teams using different tools in different markets. Without integration across geographies, a CRE leader can't compare utilization patterns in London against those in Sydney or New York. The analytics program is only as strong as its weakest regional data source.
Analytics maturity runs along a spectrum. Teams at the early stage rely on basic reporting from a single source. Teams at the advanced end use Predictive Planning to run scenarios across their full portfolio, powered by the Large Spatial Model trained on 250M+ sq ft of measured workplace data and supporting 50+ integrations with existing workplace systems.
How to Get Started With CRE Analytics
Starting your CRE analytics program doesn't require a full platform deployment on day one. Most CRE teams that move to continuous analytics begin with a focused pilot on a single building or a single portfolio question.
Pick one decision that matters, such as whether a lease renewal is justified by actual utilization, and measure it with real occupancy data. Compare the result against whatever method the team currently uses. The gap between assumption-based answers and data-driven answers typically makes the case for broader investment on its own.
From there, the path forward involves integrating additional data sources (badge, WiFi, booking, sensors), expanding measurement to more sites, and layering in scenario modeling as portfolio questions grow in complexity. Each additional data source fills in a piece of the utilization picture that no single source captures alone.
The strongest CRE analytics programs create a decision environment where leaders spend less time assembling data and more time evaluating the strategic tradeoffs that shape portfolio outcomes.
That shift, from data wrangling to strategic thinking, is ultimately what separates teams that react to their portfolio from teams that actively manage it.
Ready to see what your portfolio data is telling you?
VergeSense helps CRE leaders move from periodic studies to continuous, analytics-driven portfolio decisions.
FAQs About Corporate Real Estate Analytics
How Does Corporate Real Estate Analytics Differ From Traditional Portfolio Reporting?
Traditional reporting summarizes historical data, often from a single source like badge swipes or lease records, in periodic snapshots. CRE analytics integrates multiple data streams continuously, enabling trend analysis and scenario modeling that static reports can't support. The result is a portfolio view that stays current between decision cycles.
What ROI Can CRE Teams Expect From an Analytics Platform?
ROI varies by portfolio size and decision stage. Organizations using occupancy intelligence have reported outcomes ranging from avoided expansion costs to lease exits on underutilized buildings. The common thread is that measured utilization data surfaces savings opportunities that assumption-based planning misses.
How Long Does It Take to See Results From CRE Analytics?
Most teams see actionable insights within weeks of deploying occupancy sensors or integrating existing data sources. The Australian grocery retailer example demonstrates the speed potential: a question that took consultants weeks to answer was resolved in two hours using continuous occupancy data.
Can CRE Analytics Support Multi-Market or Global Portfolios?
Yes. Platforms built for enterprise CRE, including Meridian, aggregate data across regions, time zones, and building types. The Occupancy Intelligence Index draws from 50+ countries, and the platform supports 50+ integrations with existing workplace systems to unify data regardless of location.