

<img height="1" width="1" style="display:none;" alt="" src="https://px.ads.linkedin.com/collect/?pid=2274356&amp;fmt=gif">
Skip to content

LIVE SEPT 23: The 12th Space Planning Summit, with GlobalLogic's Dan Ramirez Save My Seat

video poster image

Know the Stack Plan Works Before
Anyone Moves

Start with a floor plan and see how teams distribute across floors, where adjacency breaks down, and whether next year's headcount fits. Layer in your own occupancy data and every scenario sharpens. Minutes, not a week of spreadsheet rework.

Download the Space Planner’s Benchmark Report


250M+ SQFT of Space Analyzed Globally

BP logo
Cisco logo
Autodesk logo
HP logo
Fresenius logo
Twilio logo
NBC logo
BP logo
Cisco logo
Autodesk logo
HP logo
Fresenius logo
Twilio logo
NBC logo

Defensible Plans in Minutes,
Not Months

Interactive space planning interface displaying a floor plan layout with color coded teams and corresponding workforce capacity statistics for real estate analysis.

Upload your floor plan and add your workforce context: headcount, attendance policy, and team mix.

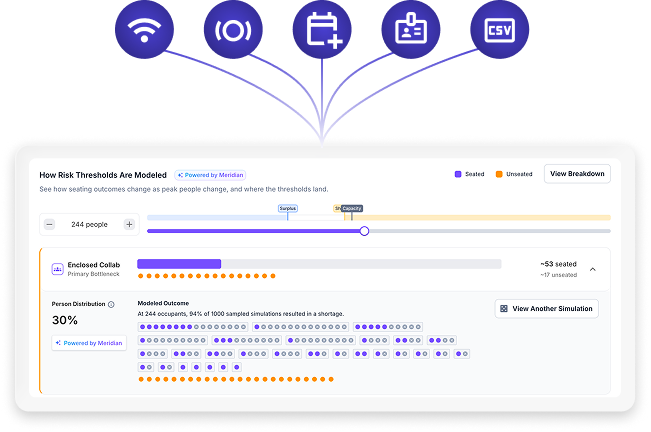
Meridian scores your space against predicted behavior, so you see true capacity rather than design capacity, where bottlenecks hit first, and what to change. No sensors, no spreadsheet rebuild, no waiting.
Explore Meridian

Built for the People Who Own the Plan

Illustration representing occupancy planners creating stacking plans

Occupancy Planners
& Space Planners

You build stacking plans and test fits, then spend hours defending them with data pulled from 3+ systems. Meridian gives you a single tool that models any scenario in minutes and produces recommendations you can stand behind.

Illustration representing corporate real estate leaders reviewing portfolio metrics

Corporate Real Estate Leaders

You own portfolio-level decisions worth millions, lease renewals, consolidations, expansions. Meridian replaces episodic consultant studies with always-on intelligence that covers your entire portfolio, including sites without sensors.

Illustration representing workplace strategy leaders analyzing team capacity

Workplace Strategy Leaders

Every policy question lands on you: how many days, how many desks per person, assigned or shared. Meridian shows what each option does to capacity and experience before you commit to it publicly, so the debate happens against a model instead of around a table.

Illustration representing facilities and operations leaders managing office space

Facilities & Operations Leaders

You're the first to hear when a floor feels too full or too empty. VergeSense gives you the data to separate perception from reality, and the evidence to act.

Everything You Need to Plan
with Confidence

How a Global Grocery Retailer Found 178 Desks It Already Had

CHALLENGE

An external consultant projected an 892-desk shortage across the corporate office portfolio, with an expansion budget attached to the recommendation.

SOLUTION

Months of hourly occupancy data measured actual peak demand instead of the 65% show-up rate the plan assumed. Reality never cleared 28%.

RESULT

A 178-desk surplus at the busiest hour on record, and $1.5M per floor in avoided expansion costs. The team could take the finding back to finance line by line.

A LEADING GLOBAL GROCERY RETAILER

$1.5M Per Floor in Avoided Expansion

An 892-desk shortage on paper. A 178-desk surplus in the data. One assumption about how often people show up was the entire difference.

Consultants Deliver a Plan.
Meridian Delivers a Planning Engine.

A consulting engagement is a project. You define scope, wait for analysis, receive a report, and repeat the cycle when anything changes. Meridian is always-on, updates in real time, and gets smarter as more data flows in. Here's what that difference looks like in practice.

Dimension
Consultant-Led Planning
Planning with Meridian
Time to first answer 3-6 months Minutes to hours
Cost per engagement $250K-1.5M+ Platform subscription
Data freshness Point-in-time snapshot Continuously updated
Scenarios modeled 1-2 per engagement Unlimited, self-serve
CFO-ready outputs Manual assembly Built-in, auto-generated
Ongoing updates Re-engage the consultant Always current, no lag
AI capabilities None Large Spatial Model (LSM)
Portfolio coverage Selected sites only Entire portfolio at once

Frequently Asked Questions

What is occupancy-based planning?

Occupancy-based planning is the practice of deciding how much space you need, what type, and where, based on measured evidence of how spaces are used rather than headcount ratios or design capacity. A traditional plan assumes one desk per person and counts seats on a floor plan. Occupancy-based planning starts from what the data shows: how many people come in on a peak day, which space types run short, and where capacity sits unused.

Meridian supports this with forecasting and continuous measurement, so the plan recalculates when attendance, headcount, or policy changes instead of going stale between annual reviews.

Do I need sensors to get started?

No. Predictive Planning works with just a floor plan, as the Large Spatial Model predicts behavior using benchmarks drawn from 250M+ sq ft of real workplace data, giving you a defensible starting baseline on day one. Sensors, WiFi, videoconferencing, and badge data make the model more precise over time by shifting from modeled to measured precision, but they're an upgrade path you add when the decision calls for it, never a prerequisite to begin.

How is this different from hiring a consultant?

Consultants deliver a static report after 3–6 months, typically costing $250K–$1.5M per engagement, and it's often outdated before it arrives. VergeSense delivers a continuously updated planning engine instead: model unlimited scenarios, get instant answers, and update plans as conditions change without re-engaging anyone. Run it yourself, or you can work with VergeSense's Strategic Advisory Services team, included with every subscription, if your team doesn't have the bandwidth to run it internally.

What data sources does VergeSense use?

The platform can ingest data from occupancy sensors (95%+ accuracy), WiFi infrastructure (up to 85% accuracy), badge systems, and booking platforms, and it automatically reconciles and de-duplicates signals across sources into a single occupancy model. For sites without any measurement in place, the Large Spatial Model uses industry benchmarks calibrated to your industry and building type to simulate realistic occupancy patterns until real data starts flowing in.

Can I model lease decisions?

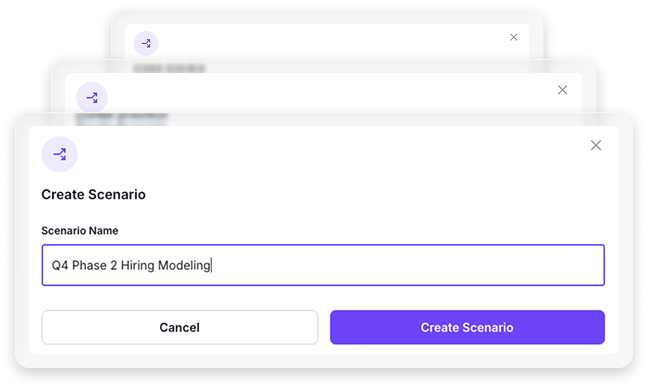
Yes. Scenario modeling lets you compare lease exits, renewals, consolidations, and expansions side by side, with predicted impact on capacity, employee experience, and cost. You can also add your building's actual lease costs, annual lease cost, OPEX, lease length, and expiration date, directly in Predictive Planning, so every scenario carries real financial context instead of relying on a separate spreadsheet to translate space decisions into dollars.

How accurate are the forecasts?

Predictive Planning uses Monte Carlo simulation, running 1,000+ scenarios per plan, to produce probabilistic forecasts with confidence intervals rather than a single-point guess. That means you see a realistic range of outcomes, not just one number to bet a lease decision on. When connected to live occupancy data from sensors, videoconfeencing systems, or WiFi, forecasts shift from modeled to measured precision and calibrate to your building's actual behavior over time.

What does a CFO-ready output look like?

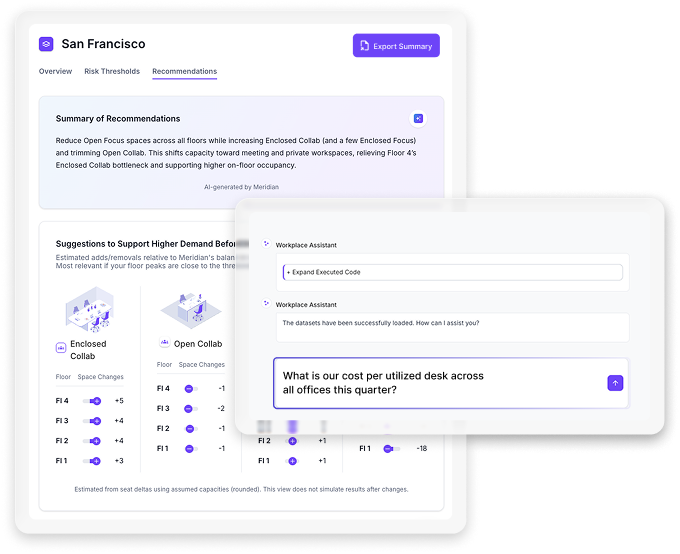
AI-generated executive summaries showing capacity surplus or shortage by building, cost impact per scenario, payback timelines, and employee experience risk scores, all in language a finance audience can act on without translation. Every number traces back to real behavioral data rather than assumptions, so you can walk into a leadership meeting and defend the recommendation directly instead of building a separate business case to support it.

Does this work for global portfolios?

Yes. Predictive Planning adjusts for regional work patterns, team composition, and local attendance behavior, so a forecast for your Singapore office isn't built on the same assumptions as one for London. Run scenarios across hundreds of buildings at once, including unmeasured sites where you have no sensors or WiFi data yet, all from a single platform instead of stitching together separate regional reports.

Can I integrate with our IWMS or HR systems?

Yes. VergeSense integrates with major IWMS platforms natively and is available via a fully documented API for anything not covered by an existing connector. Headcount feeds from HR systems to automatically update demand forecasts are on the product roadmap; today, you can incorporate headcount data manually to model reorg, growth, or team stack scenarios. Contact our team for the current integration list for your stack.

How quickly can I model a specific scenario?

Seconds. Change an input, headcount, a policy shift, an attendance assumption, and the model recalculates instantly rather than requiring a new round of analysis. There are no spreadsheets to rebuild and no waiting on a consultant's next deliverable. This is what makes it possible to test five scenarios in a single meeting instead of committing to one plan based on a single static study.