



You Own the Stack Plan. And Everything That Happens After.
Stack plans, team moves, sharing ratios, growth absorption. Meridian lets you test each one against predicted demand before you make changes, so each plan is backed by evidence.

.png?width=100&height=53&name=Layer_1%20(1).png)
.png?width=150&height=15&name=Layer_1%20(2).png)
.png?width=50&height=50&name=Layer_1%20(3).png)
.png?width=150&height=33&name=Layer_1%20(7).png)
.png?width=100&height=30&name=Layer_1%20(4).png)
.png?width=50&height=51&name=Layer_1%20(6).png)

You’re stitching together badge data, Wi-Fi logs, booking reports, and sensor feeds in spreadsheets. Each source tells a different story, and reconciling them takes days of manual work before you can even start planning.
Industry benchmarks don’t reflect your building. Generic ratios from research reports don’t account for your workforce’s specific behavior, your floor layouts, or your hybrid policy. You’re planning with someone else’s averages.
Every “what if” takes hours of manual rework. Headcount change? Policy shift? New floor plan? You rebuild the model from scratch in Excel, re-run the numbers, and re-assemble the presentation. Again.
You can’t answer “when will this floor hit capacity?” Stakeholders want to know when spaces will break, not just what’s happening today. Without predictive capability, you’re always reacting instead of anticipating.


Floorplan-Based Scenario Modeling
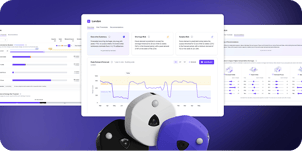
Upload any floorplan and model unlimited scenarios: headcount changes, policy shifts, redesigns, consolidations. Meridian recalculates capacity, demand, and space mix performance instantly.

Capacity Risk Threshold Analysis
See exactly when and where spaces hit their capacity, not just their physical limit. Meridian identifies which space types degrade first and at what attendance level, so you plan around risk, not averages.

AI-Generated Space Change Recommendations
Meridian doesn’t just identify problems. It tells you precisely what to change: how many of each space type to add or remove, and the projected impact on experience and capacity.

Multi-Source Data Unification
Bring badge, sensor, videoconferencing, Wi-Fi, and booking data into a single view. Meridian automatically de-duplicates and reconciles conflicting signals, so you stop spending days on data prep and start planning immediately.

Continuous Forecast Updates
Plans update automatically as new behavioral data flows in. Forecasts get more accurate over time without manual recalibration.

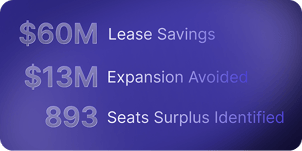
of ghosted meetings eliminated
(Consulting Firm)

neighborhood footprint reduction
(Insurance Co.)

in expansion costs avoided
(Biotech)
Why Spreadsheets and Consultant Studies Can’t Keep Up
Planning used to be a project. Now it’s a process, one that gets smarter every day.
| Legacy Approach | With Meridian |
|---|---|
.svg) Manually stitching together badge, sensor, Wi-Fi, and booking data Manually stitching together badge, sensor, Wi-Fi, and booking data |
 Unified data model that reconciles all sources automatically Unified data model that reconciles all sources automatically |
|
Generic industry benchmarks |
Personalized demand forecasts backed by 250M+ sq ft of real behavior |
|
Hours to rebuild a model when assumptions change |
Instant scenario recalculation with any input change |
|
1–2 scenarios per consultant engagement |
Unlimited self-serve scenario modeling |
|
Static floor plans in PowerPoint and CAD |
Dynamic floor plans with predicted performance overlays |
|
Consultant delivers a report and walks away |
Continuous planning engine that updates as data flows in |