


<img height="1" width="1" style="display:none;" alt="" src="https://px.ads.linkedin.com/collect/?pid=2274356&amp;fmt=gif">
Skip to content

NEW REPORT: The Self-Adapting Workplace, from VergeSense & WORKTECH Academy Download Now

Search icon
Aerial layout view of a modern corporate office building highlighting global portfolio space planning

CUSTOMER STORIES

How a Global Pharmaceutical Company Turned Existing WiFi Into Portfolio Intelligence Across 2.9M SQFT

  • Icon representing the pharmaceutical industry
    INDUSTRY:

    Pharmaceuticals

  • Icon showing a phased rollout from a pilot space to a large square footage deployment
    IMPLEMENTATION:

    30K sq ft pilot → 2.9M Sq Ft Rollout

  • Icon depicting a large corporate workforce of over fifty thousand employees
    COMPANY SIZE:

    50,000+ Employees

  • Icon representing portfolio space planning and office neighborhood design
    USE CASE:

    Portfolio Planning & Neighborhood Design


The Challenge

This global pharmaceutical company needed neighborhood-level occupancy data to allocate desks effectively and support broader space-planning goals. Their existing occupancy tool couldn’t break down usage by specific neighborhoods or zones, making it impossible to manage desk allocations or plan neighborhood programs.

The smart buildings team also wanted to consolidate all WiFi-based occupancy data into a single platform for real-time analysis at scale. Multiple disconnected tools meant fragmented views and no enterprise-wide visibility. Site leads across the globe lacked a unified way to access their own building data.

Diagram showing fragmented occupancy data across different corporate building zones

Illustration of disconnected office management tools causing lack of enterprise-wide visibility

The Solution

The company switched to VergeSense’s WiFi Analytics integration, which connected seamlessly with their existing Cisco Spaces infrastructure. VergeSense provided neighborhood and zone-level occupancy data through a single platform, allowing desk allocation, utilization analysis, and portfolio planning in one place.

They started with a 30K sq ft pilot to validate the technology, followed by a planned rollout across 2.9M sq ft. Custom reporting, API access for downstream systems (cleaning, sustainability), and single-login access for all site leads streamlined operations.

The Results

Graphic illustrating the successful validation of the initial thirty thousand square foot pilot
30K Sq Ft

Pilot Validated Approach

Graphic illustrating the planned expansion across two point nine million square feet
2.9M Sq Ft

Planned roll out

For the first time, the company has a consolidated view of occupancy across its entire global portfolio, from building-level trends down to neighborhood utilization, all through existing WiFi infrastructure without additional hardware. Site leads can independently access relevant data for their buildings, floors, and neighborhoods.

The platform now supports better team assignments and collaboration planning, informed sustainability and cleaning initiatives, and streamlined portfolio management decisions.

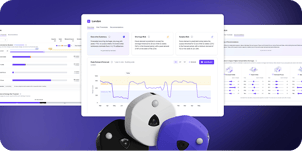
Dashboard overview displaying unified global occupancy trends and neighborhood utilization data

What’s Next?

The company plans to also leverageVergeSense Infinity area sensors in high-priority
spaces where desk-level and room-level precision is needed, building a multi-signal occupancy
intelligence layer across the full portfolio.

Explore Other Resources