

<img height="1" width="1" style="display:none;" alt="" src="https://px.ads.linkedin.com/collect/?pid=2274356&amp;fmt=gif">
Skip to content

LIVE SEPT 23: The 12th Space Planning Summit, with GlobalLogic's Dan Ramirez Save My Seat

video poster image
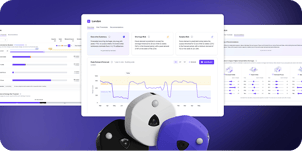
A digital UI dashboard displaying a detailed floor plan heat map with utilization metrics, capacity percentages, and spatial analytics for Floor 3
For WORKPLACE Leaders

Prove the Program Is Working

Policy changes, redesigns, amenity investments, and how people actually use what you built. Meridian gives you measured evidence for each of them, floor by floor and site by site.


Trusted by Workplace Teams Creating
Better Employee Experiences

BP logo
Cisco logo
Autodesk logo
HP logo
Fresenius logo
Twilio logo
NBC logo
BP logo
Cisco logo
Autodesk logo
HP logo
Fresenius logo
Twilio logo
NBC logo

THE PROBLEM

Everyone Has an Opinion About Your Workplace. Nobody Has the Data.

If you’ve ever redesigned a floor based on employee feedback, only to watch the same complaints surface six months later, the problem wasn’t the design. It was the data behind it.
 

Plan, Measure, Prove it Worked.

Score design against behavior
PLAN

Evaluate Any Floorplan Against Predicted Behavior

Before making design changes, model how a proposed floor plan will stand up to employee demand. Meridian predicts which space types will bottleneck first and where experience degrades, so you can proactively adjust constraints.

Measure whats actually happening
REFINE

Measure What’s Actually Happening

See utilization at the space-type, neighborhood, and floor level. Identify which collaboration zones actually get used, which focus areas overflow, and how patterns shift across days and hours.

A 3D predictive spatial simulation showing bottleneck areas and forecasted occupancy demand across floor zones.
ACT

Make Targeted Changes Backed by Behavioral Evidence

Get AI-generated recommendations specific to each floor, like “add 3 huddle rooms, convert 15 open desks to enclosed focus spaces,” with projected impact on experience and capacity.


Built for the Team That Has to
Answer for Workplace Decisions

How Workplace Leaders Turned Data into Decisions

LIFE SCIENCES COMPANY
Fishbeck logo

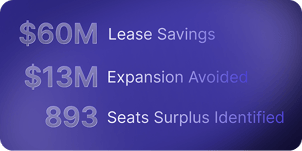
Found that spaces recorded as taken were passively occupied, redesigned floors around how teams were really working, and avoided $13M in expansion they had been planning for.

Read the Full Story

A purple square icon containing a white bell notification symbol representing a sixty-three percent neighborhood footprint reduction for an insurance client.
63%

neighborhood footprint reduction
(Insurance Co.)

A purple square icon displaying a white tag symbol representing thirteen million dollars in avoided expansion costs for a biotech client.
$13M

in expansion costs avoided
(Biotech)

A purple square icon featuring a white upward-trending line graph symbol representing data-driven workplace strategy evolution.
Data-driven

workplace strategy evolution
(Fishbeck)

Why Surveys & Consultants Can't Keep Up

One gives you opinions. The other gives you a PDF. Neither gives you a plan.

The Legacy Approach With Meridian
Cross markAnnual employee survey or badge data
check markContinuous behavioral measurement across every space
Vector (1)Space sharing ratios from industry benchmarks
check markDemand predictions based on your workforce’s behavior
Cross markNew conditions or questions require commissioning new consulting project
Check markAnswers in hours, continuously updated
Cross markPost-occupancy evaluation 6 months after move-in
Check markReal-time performance data from day one
Cross markOne-size-fits-all design standards
Check markFloor-specific, AI-generated design recommendations
Cross markGut feel on what’s working
Check markNeighborhood-level utilization data you can present to leadership

Frequently Asked Questions

How does VergeSense help improve workplace experience?

VergeSense measures how employees actually use every type of space, from focus desks to collaboration zones to social areas, rather than relying on assumptions about what people need. This behavioral data reveals what's working, what's underused, and where employees are struggling to find the space they need most. Workplace teams use these insights to make targeted design changes that improve the day-to-day experience, instead of redesigning based on guesswork or the loudest complaint in the room.

Can VergeSense measure how neighborhoods perform?

Yes. VergeSense provides neighborhood-level analytics showing utilization, space type performance, and attendance patterns for every defined zone in your portfolio. You can compare neighborhoods against each other, track performance over time, and identify which design concepts actually drive the best outcomes for a given team or work style. That makes it possible to replicate what's working in one neighborhood rather than redesigning the whole floor from scratch.

Is the occupancy data anonymous?

Yes. VergeSense detects presence, not identity. Sensors measure whether a space is occupied and how many people are present, but never identify who they are, and no personally identifiable information collected or stored. The platform is GDPR compliant and SOC 2 Type II certified, so workplace teams can gather the behavioral data they need without raising privacy concerns among employees or legal review.

How do employees benefit from occupancy intelligence?

Employees benefit from better-designed spaces that match how they actually work, not how a policy assumes they work. When workplace teams use behavioral data instead of assumptions, the result is fewer overcrowded meeting rooms, more available focus space, better-calibrated collaboration zones, and an overall experience that feels intentionally designed around real needs rather than retrofitted after complaints pile up. The space adapts to people, not the other way around.

What space types can VergeSense measure?

VergeSense measures any defined space type including open desks, enclosed offices, meeting rooms, huddle rooms, collaboration zones, phone booths, social and lounge areas, and custom-defined space categories specific to your portfolio. Data is captured at the individual space, zone, neighborhood, floor, building, and portfolio level, so you can zoom in on a single conference room or zoom out to compare performance across your entire real estate footprint.

How does VergeSense handle hybrid work patterns?

VergeSense captures day-by-day and hour-by-hour usage patterns, revealing how hybrid policies actually translate into behavior on the ground. You can see the difference between peak days and quiet days, identify exactly when specific space types hit capacity, and design for the attendance patterns that actually occur rather than the policy written on paper. That gap between stated policy and real behavior is usually where the biggest planning mistakes happen.

Can I use VergeSense data to redesign floors?

Yes. Predictive Planning lets you model proposed floor plans against predicted real-world behavior before construction begins, not after. It then identifies which space types will bottleneck under different attendance scenarios, recommends specific changes, and scores designs based on forecasted performance, so you validate the layout before you build it. That means catching a room mix problem in a model instead of discovering it three months after the redesign is finished.

Join 200+ enterprises in 50 countries

Design the Workplace Your Team Deserves

Get a walkthrough tailored to your workplace goals. We’ll show you how your spaces compare to behavioral benchmarks from 200M+ sq ft, and where targeted changes will have the biggest impact on experience.

Download the 2026 Workplace Index