



8 Best Occupancy Analytics Platforms in 2026
Most occupancy analytics platforms report how a floor was used last quarter. Whether a platform can also tell you how this should influence your next lease decision separates the shortlist.
Some platforms are built to measure what already happened, while others to forecast demand and plan space around it. Both have a place, and which one you need depends on the decisions your team actually makes.
The platforms below span four categories, and the right shortlist usually depends on which of these matches how your team already works: sensor-first occupancy platforms that generate their own data, WiFi and badge analytics that read existing network signals, IWMS suites that manage the lease and space record, and workplace analytics tools that model on data you supply.
- VergeSense: Multi-source occupancy analytics and AI forecasting that turn how space is used into your next portfolio decision
- Basking: WiFi-based occupancy analytics built for fast deployment and lease optimization
- Butlr: Thermal, privacy-first anonymous people counting for workplace and beyond
- XY Sense: Real-time workplace occupancy sensor analytics with historical reporting
- Trebellar: Agent-based workplace analytics that models on customer-supplied data
- OfficeSpace Software: Workplace management with AI-assisted space and utilization analytics
- Lambent: WiFi-based occupancy analytics that runs on existing infrastructure
- Tango: IWMS covering lease administration, space management, and portfolio analytics
Want to see how your workplace stacks up before you shortlist a tool?
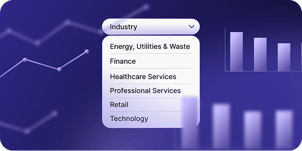
The Occupancy Intelligence Index pulls benchmarks from the world's largest measured workplace dataset, so you can compare your utilization by industry, region, and day of week.
At-a-Glance Comparison of Occupancy Analytics Platforms
Here is how the eight platforms compare on what they measure, what they run on, and how far each takes you past reporting.
|
Tool |
Best For |
Core Approach |
Data Inputs |
Analytics & Planning Depth |
Best-Fit Buyer |
|
VergeSense |
Turning all your occupancy data into forecasts you can plan against |
Space-level sensing with benchmark context and scenario modeling |
Area sensors, entryway sensors, WiFi, badge, booking |
Space-level analytics, cross-portfolio benchmarks, post-change verification |
CRE and workplace leaders at large, multi-site portfolios |
|
Basking |
Fast portfolio-wide visibility |
WiFi-based occupancy analytics with lease tie-in |
WiFi, badge, and sensor signals |
Building and floor-level trends, right-sizing, lease correlation |
Teams wanting quick coverage without new hardware |
|
Butlr |
Privacy-sensitive people counting |
Anonymous thermal sensing |
Thermal occupancy sensors |
Space utilization measurement and reporting |
Workplaces prioritizing privacy and anonymous counts |
|
XY Sense |
Real-time space-level accuracy |
Occupancy sensors with live analytics |
Area, presence, and entry sensors |
Real-time and historical utilization, layout evaluation |
Workplace teams optimizing active office floors |
|
Trebellar |
Unifying existing real estate data |
Agent-based analytics and planning layer |
Customer-supplied badge, WiFi, booking, HRIS data |
Scenario modeling on the customer's own data |
RE teams with mature data wanting a planning layer |
|
OfficeSpace Software |
Booking-led workplace management |
Workplace management suite with AI analytics |
Booking, moves, and integrated utilization data |
Utilization reporting and AI-assisted space planning |
Facilities and workplace ops teams managing daily operations |
|
Lambent |
Software-only utilization insights |
WiFi-driven occupancy analytics |
Existing WiFi network signals |
Building and campus utilization trends |
Higher-ed and CRE teams avoiding hardware installs |
|
Tango |
Managing the lease and space record |
IWMS with portfolio analytics |
Lease, transaction, and space inventory records |
Portfolio and lease analytics on managed inventory |
Enterprises centralizing lease and space administration |
Best Occupancy Analytics Platforms in 2026
When you compare these platforms closely, four criteria separate them:
- How accurate the underlying data is
- Whether the analytics support decisions or just report on the past
- How well the tool scales across a portfolio
- Whether you can check the outcome against the forecast once a change is in
The entries below evaluate each platform on those standards and notes where each one fits and where it doesn't.
1. VergeSense
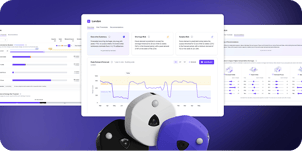
VergeSense unifies the data you already have, including badge, WiFi, room booking, video conferencing, and third-party sensors, with its own measurement where gaps remain, and analyzes occupancy down to the individual space. That means insights can speak to a single room type or neighborhood, not a floor average, and forecast how changes there will play out.
VergeSense's platform, Meridian, then sets your numbers against an AI model trained on 250M+ sq ft of measured workplace data across 210+ enterprises, so a utilization figure arrives with context. The same model produces forecasts you can plan against, enabling you to return after a consolidation or a redesign to check the result against what was predicted.
Selected features
- Infinity Area Sensor: A wireless, battery-powered sensor with a magnetic mount and roughly a 10-year battery life, installed without cabling or construction.
- Occupancy Intelligence: Space-level, floor-level, and neighborhood analytics that unify multiple data sources into one occupancy signal.
- Predictive Planning: Upload a floor plan and model capacity, space-type mix, and team placement scenarios before you build.
- Large Spatial Model: The benchmark layer, trained on 250M+ sq ft of measured workplace data across 210+ enterprises, so your utilization numbers can be read against comparable portfolios.
- Workplace Assistant: Pull the numbers behind a chart by asking for them in plain language, drawn from your own historical occupancy data.
- Portfolio-to-zone granularity: Filter the same dataset from portfolio trends down to one room type, one neighborhood, or one space.
- Enterprise integrations: Connections with Microsoft Places, ServiceNow WSD, Juniper Mist, and Cisco Meraki.
Best for
Enterprises whose space questions are specific: which room types are under pressure, which neighborhoods sit empty, whether last year's redesign actually worked. It fits CRE and workplace teams where lease decisions, neighborhood right-sizing, and post-occupancy verification come with serious financial implications.
A real-life example
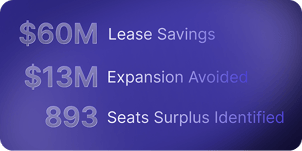
An Australian financial services firm with 3,000+ employees saved $18M over three years by consolidating from 14 floors to 11 after a merger. Rather than guessing at post-merger space needs, the team used its own measured occupancy readings, set against the VergeSense Large Spatial Model, to right-size with confidence, then verified the outcome once the consolidation was complete.
Want to see which of your rooms and neighborhoods are actually earning their space?
A VergeSense specialist can show you your own space-level numbers and how they read against the benchmark.
2. Basking
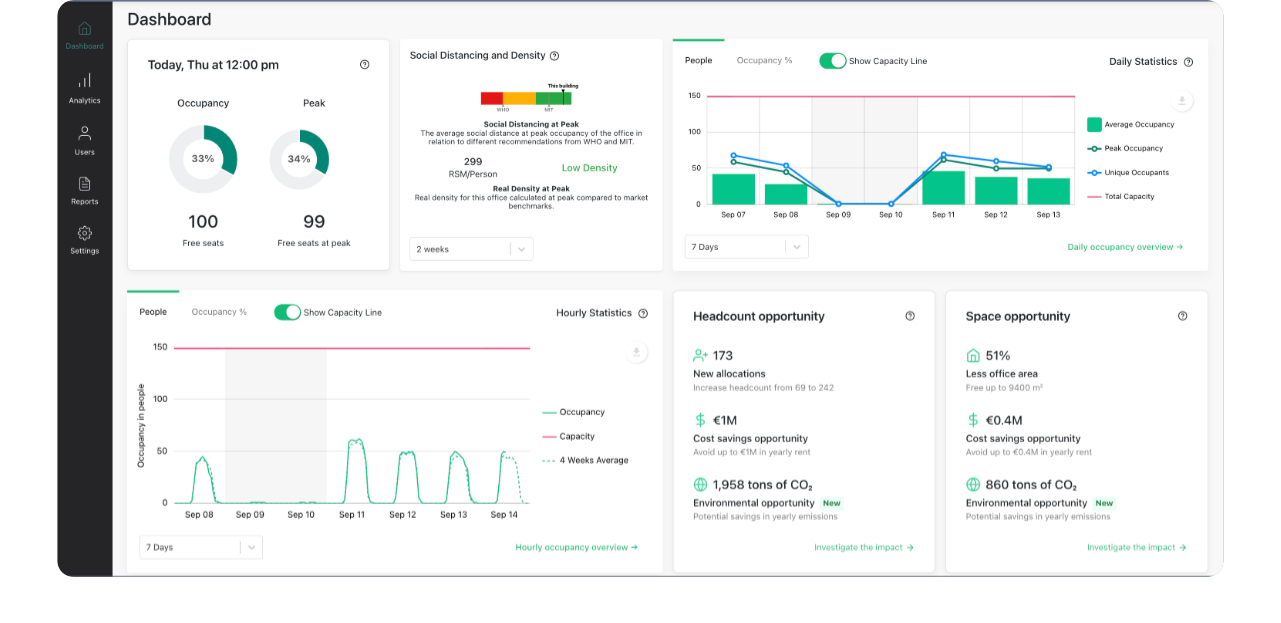
Basking is a WiFi-based occupancy analytics platform designed for fast deployment and lease optimization. It reads presence from existing WiFi, badge, and sensor signals to build a unified occupancy picture across a portfolio, then ties that usage back to lease data. That means coverage across a portfolio without waiting on a hardware rollout.
Selected features
- Unified occupancy signal combining WiFi, badge, and sensor inputs.
- Utilization dashboards with real-time updates, plus forecasting.
- Right-sizing analysis to flag under-used space.
- Lease-to-occupancy correlation connecting contractual obligations to actual usage.
- Automated portfolio reporting and anomaly detection.
Example use cases
- Getting portfolio-wide utilization coverage without installing new sensors.
- Building the cost-per-square-foot case for a lease renewal or exit.
The tradeoff
Basking is not sensor-first. It reads WiFi and badge signals and can take in sensor data, but the sensing itself has to come from somewhere else. Getting an accurate, space-level picture means running Basking alongside another platform and piecing the two views together.
3. Butlr
Butlr is a privacy-first occupancy sensing platform built on anonymous thermal technology. Its sensors detect presence and movement without capturing faces, video, or any personally identifiable information, so privacy is built into the hardware itself. The wireless sensors can be installed without cabling, which makes them straightforward to scale across floors and buildings.
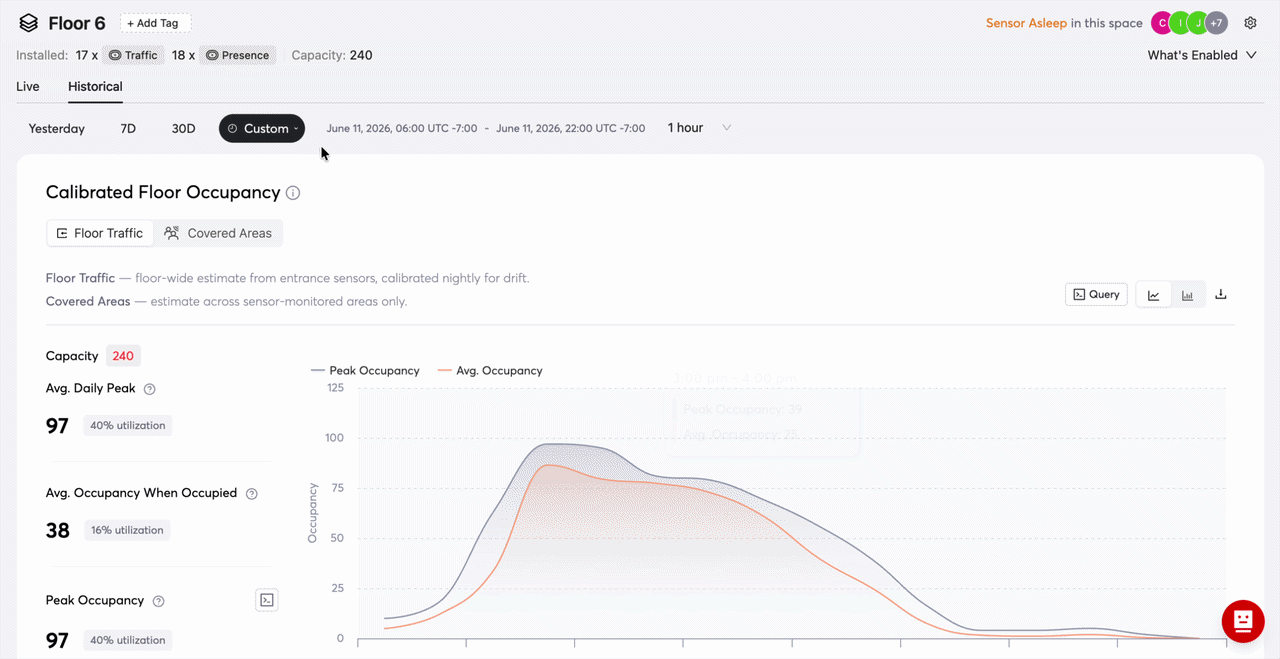
Selected features
- Anonymous thermal sensing that can't capture identities.
- Camera-free, hardware-level privacy design.
- Wireless sensors that install without construction.
- Space utilization and movement pattern insights.
- Deployments spanning single floors to global portfolios.
Example use cases
- Measuring occupancy in privacy-sensitive environments where cameras are off the table.
- Tracking space utilization across multi-building real estate.
The tradeoff
Wireless, self-install sensors also carry an upkeep cost once they’re in place. One VergeSense customer who ran Butlr before switching says her team was regularly up ladders changing batteries and fixing issues. Since moving to the VergeSense Infinity Area Sensor, with its roughly 10-year battery, she hasn’t had a single issue.
4. XY Sense
XY Sense provides workplace occupancy sensor analytics, pairing real-time analytics with historical views. Its sensors report occupancy continuously, and the platform layers dashboards, heatmaps, and layout evaluation on top. Processing happens on-device with no images captured, which keeps the accuracy high while addressing privacy concerns on active office floors.
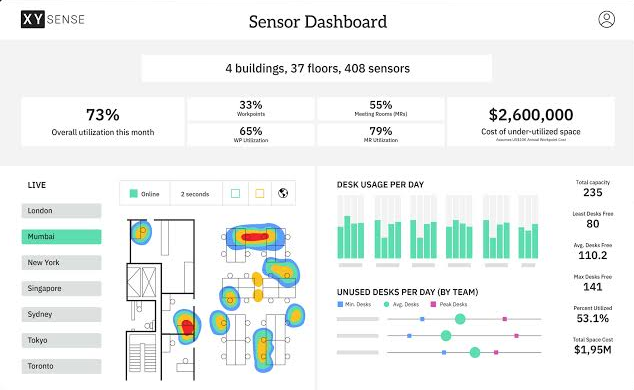
Selected features
- Area Pro Sensor: Covers open areas, meeting spaces, and social spaces up to around 3,000 sq ft.
- Presence Sensor: Designed for small spaces, pods, and flexible furniture areas.
- Entry Sensor: Measures entry and exit traffic for an occupancy count.
- Live real-time views of occupancy levels with frequent refresh.
- API access to real-time occupancy data and historical records for integration.
Example use cases
- Understanding real-time demand for meeting rooms and collaboration areas.
- Evaluating whether a floor layout matches how people actually move through it.
The tradeoff
XY Sense excels at accurate, real-time measurement of active spaces. The heavier lift comes when you want to forecast demand across a whole portfolio and model plans against it, which sits beyond real-time sensing and dashboards.
5. Trebellar
Trebellar is an agent-based workplace analytics platform for corporate real estate and workplace teams. It unifies fragmented data from existing systems and turns it into scenario modeling and decision support. Trebellar doesn't generate occupancy data itself. Instead, it works with the badge, WiFi, booking, and HRIS data a customer already supplies.
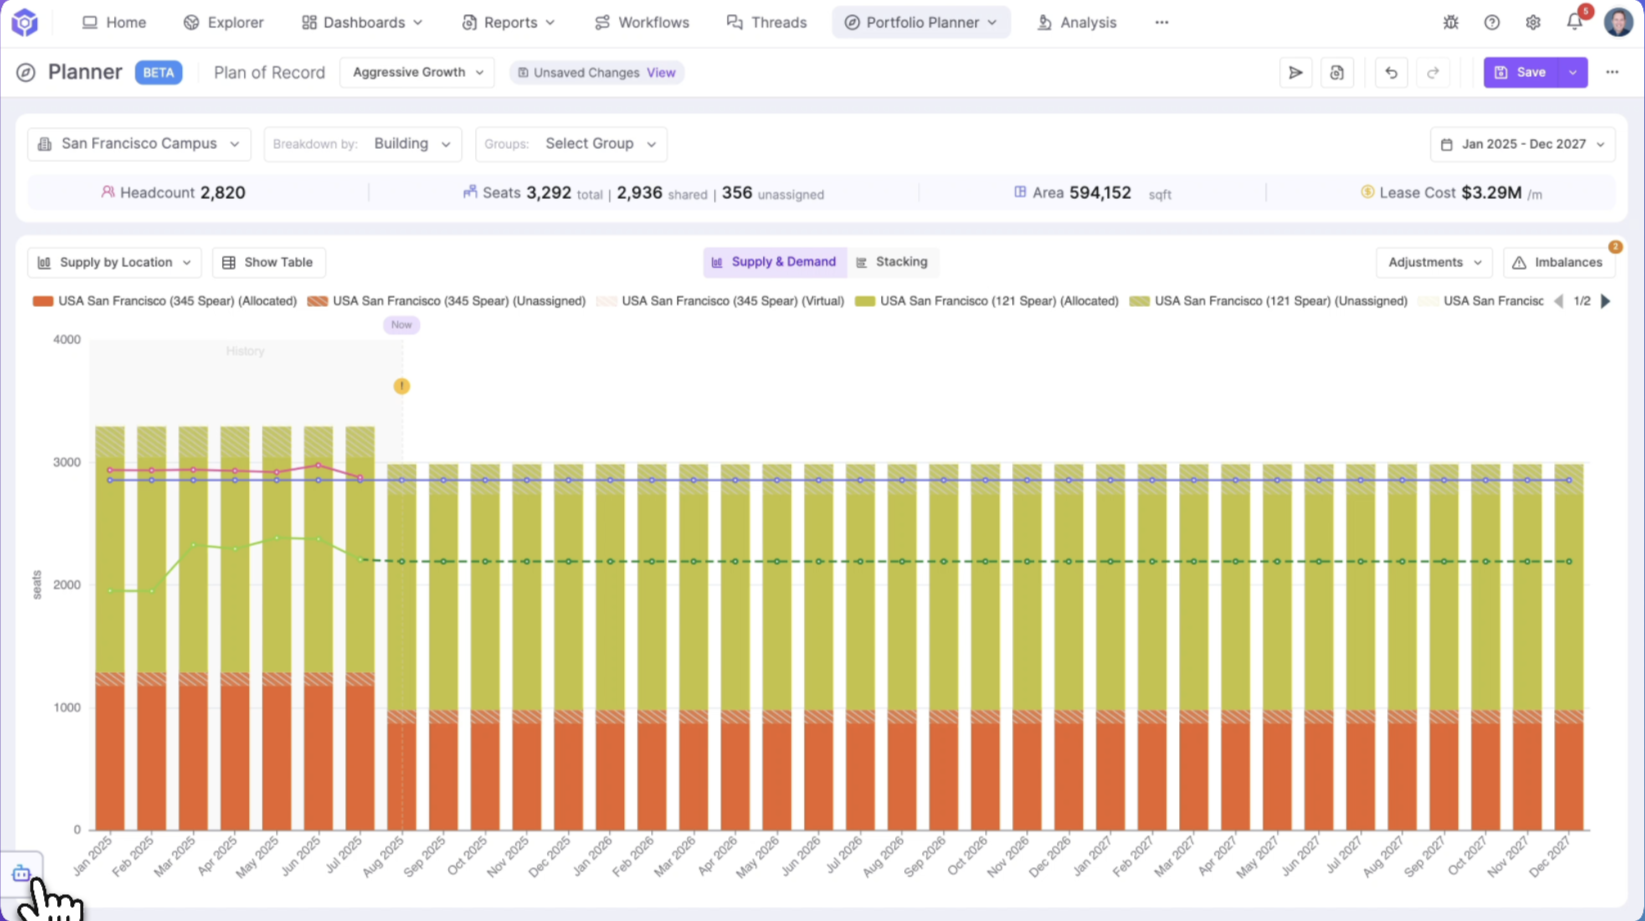
Selected features
- Explorer: A unified interface across multiple real estate data sources.
- Reports: AI-generated insights and executive-ready recommendations.
- Dashboards: Interactive, customizable visualizations.
- Planner: Scenario modeling and predictive analytics.
- Integrations spanning badge, WiFi, booking, HRIS, and IoT inputs.
Example use cases
- Consolidating scattered real estate data into one analytics layer.
- Running planning scenarios for teams that already have mature data pipelines.
The tradeoff
Because Trebellar models on customer-supplied data, its outputs depend entirely on the completeness and quality of the inputs you provide. It also trains models on your data alone, so a small portfolio gets a model built on just those buildings, and gaps in the source data carry straight through to the forecast.
6. OfficeSpace Software
OfficeSpace Software is a workplace management platform for facilities and workplace leaders. It handles desk and room booking, moves, facilities operations, and asset management, with analytics layered on top. Its AI Canvas and Dojo AI agents assist with space planning and adjacency optimization, while its Insights component reports on utilization and portfolio trends.
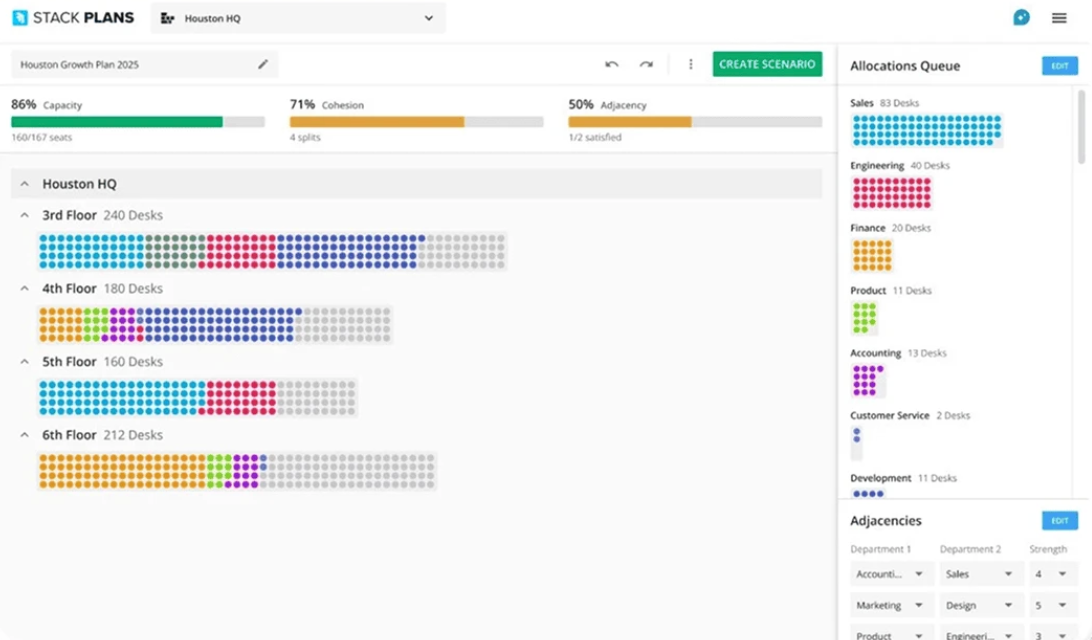
Selected features
- Space and real estate planning with data-driven floor plans.
- AI Canvas and Dojo AI agents for adjacency and space planning.
- Desk booking, room reservations, and moves management.
- Insights analytics for utilization reporting and trends.
- Integrations with Microsoft Teams, Slack, and Google.
Example use cases
- Coordinating hybrid work schedules, bookings, and moves in one system.
- Reporting on utilization for spaces already managed in the platform.
The tradeoff
OfficeSpace is built around booking and workplace management, and its AI planning focuses on adjacency optimization rather than behavioral modeling on cross-portfolio data. That's useful for arranging teams, but it falls short of forecasting demand from measured behavior at scale.
7. Lambent
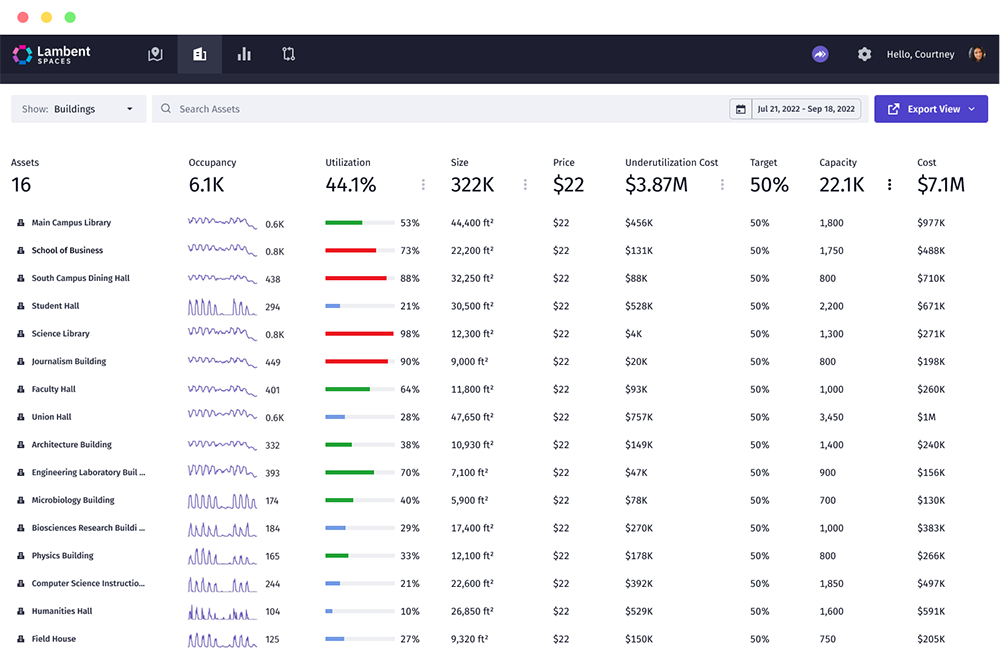
Lambent is a space planning platform that uses WiFi-driven occupancy analytics. It reads anonymous data points from existing WiFi networks to reveal utilization trends across buildings and campuses, so it needs no new hardware to get started. That software-only model makes it a lighter lift for organizations that want insights without an installation project.
Selected features
- WiFi-driven occupancy analytics using existing infrastructure.
- No new hardware required to deploy.
- Multi-building and campus utilization visualization.
- Room-reservation validation against actual space usage.
- Support for leasing, facility, and capital planning decisions.
Example use cases
- Giving higher-ed and CRE teams utilization visibility without hardware.
- Settling space disputes with usage evidence rather than opinion.
The tradeoff
Like other WiFi-based tools, Lambent reports occupancy at the building and campus level, not down to the individual space. Floor-level WiFi accuracy suits broad trend analysis, but space-level decisions call for more precise measurement.
8. Tango
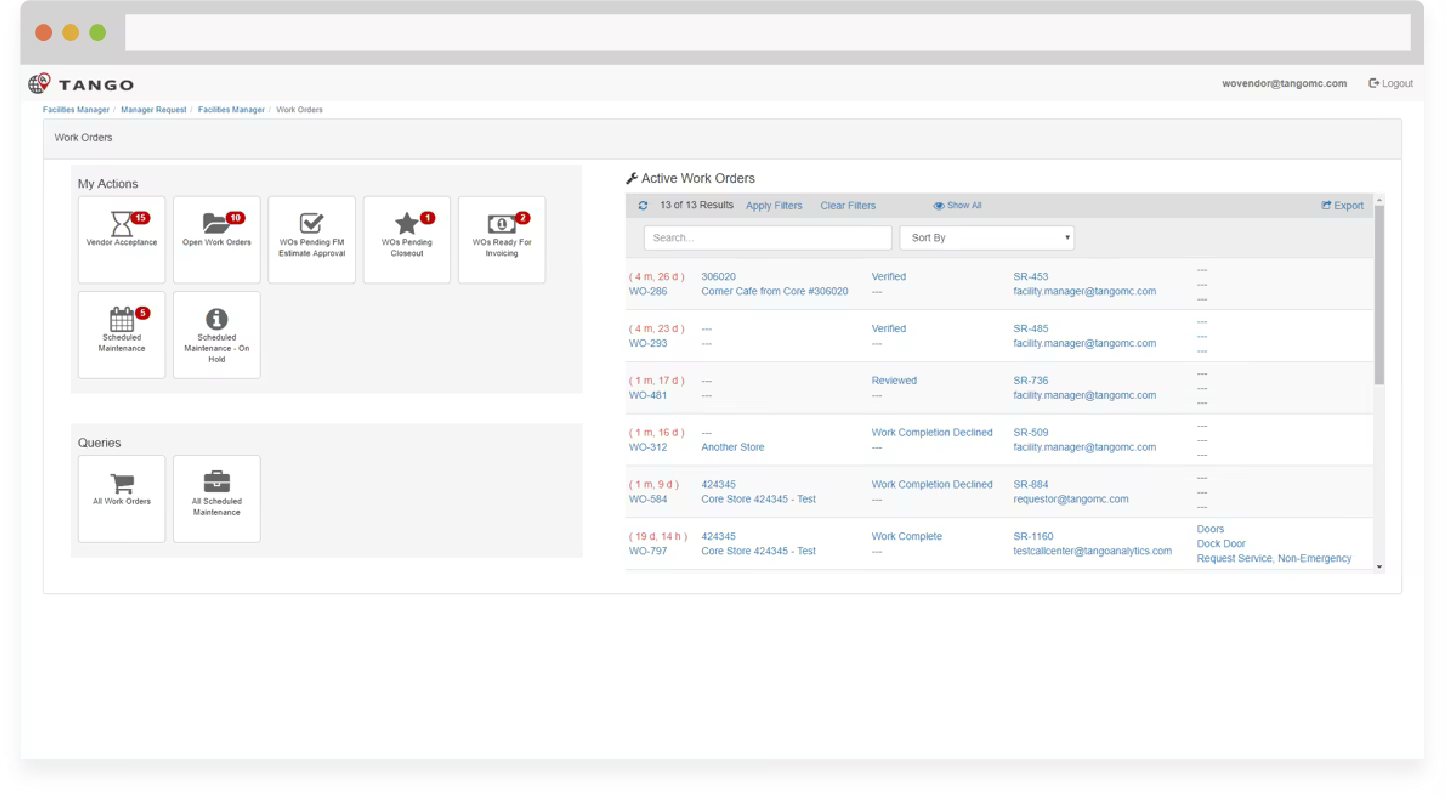
Tango is an IWMS platform that centralizes the lease and space record across a portfolio. It covers lease administration and accounting, space and move management, transaction management, and portfolio analytics. Tango uses historical, live, and forecasted occupancy data to help you make smarter space planning and lease decisions.
Selected features
- Lease administration and accounting.
- Space and move management with occupancy analytics.
- Lease and property transaction management.
- Portfolio analytics and strategy tools.
- Energy, sustainability, and maintenance modules.
Example use cases
- Centralizing lease data and accounting across a large portfolio.
- Running portfolio analytics on managed space inventory.
The tradeoff
Tango does report occupancy, drawing on historical, live, and forecasted data alongside the lease and space record. The measurement comes from your existing network rather than dedicated sensing, and Tango's own guidance notes that network connections will not pinpoint where someone is inside the office. That puts its resolution at the building and floor level, so space-level questions need a sensing layer alongside it.
Comparing tools on how they turn measurement into decisions?
The Occupancy Intelligence Index shows the utilization and peak-capacity benchmarks that separate reporting from real planning.
Key Features and Capabilities to Prioritize in Occupancy Analytics
These are the capabilities to look for if you want a platform that changes how you make space decisions.
1. Occupancy Data Accuracy
The accuracy of your office occupancy data is the foundation, because every downstream decision inherits it. VergeSense area sensors measure at roughly 95% accuracy at the space level, while WiFi-based signals land closer to 85% at the floor level. Coarser data is fine for broad portfolio trends. It isn't enough when the decision is about a single room or neighborhood.
2. Reporting vs Decision Support
Reporting-first tools are strong at dashboards and historical usage patterns. Decision support adds forecasting and scenario modeling, so a platform can tell you what happens to a floor if you consolidate two teams onto it before anything is final
3. Flexibility in Data Inputs and Deployment
The strongest platforms don't force you into one data source. Look for the ability to combine badge access data, room-booking systems, WiFi connections, videoconferencing data, and occupancy sensors into a single signal. Flexibility here also shapes deployment speed, since teams can start with the data they already have and add sensors where precision matters most.
4. Planning and Forecasting Capabilities
Look for whether a platform can model capacity, space-type mix, and team placement before you commit real estate to them. This is where measurement turns into avoided cost, because you can stress-test a plan against real behavior instead of assumptions.
Kathleen Carell, Global Workplace Strategy Lead at Takeda, put the shift plainly at the Occupancy Intelligence Summit: "In the old days, everybody counted seats, and it's really hard to get people to transition outside of talking about counting seats and work points... When we talk about demand, we have to know what the typical daily headcount is. How many people do we need to design space for?"
5. Enterprise Readiness and Scalability
For multi-site portfolios, a tool has to hold up across regions, buildings, and thousands of spaces without falling apart. Enterprise readiness shows up in integrations, security posture, and whether the same view scales from portfolio down to a single zone. A platform that works on one floor but strains across a global footprint won't deliver much value.
6. Outputs That Different Stakeholders Can Use
Occupancy data serves several audiences at once, and each needs a different output. A CRE leader wants portfolio right-sizing evidence, a workplace experience leader wants neighborhood and space-type insight, and finance wants a cost case it can put in front of a board. Look for outputs each of them can act on rather than a single report everyone has to reinterpret.
How to Choose Occupancy Analytics for Your Team and Workflows
The best tool on paper isn't always the best fit for how your team actually works. These questions help you match a platform to your decisions, your data, and your portfolio.
Questions to Ask Internally
- What decisions are we trying to make: measuring current use, planning future space, or both?
- What data do we already have, and what would we need to add?
- How precise do our decisions need to be, floor-level or space-level?
- Who will consume the outputs, and what do they each need to see?
- What's the cost of getting a lease or right-sizing decision wrong?
Questions to Ask Vendors
- Does the platform generate its own data, or does it depend on data we supply?
- Can it forecast and model scenarios, or does it only report on the past?
- How accurate is the underlying occupancy measurement, and at what level?
- How does it scale across a multi-site portfolio?
- Can we verify outcomes after we make a change, or does that require separate instrumentation?
Decided what you need from an occupancy analytics platform?
Get data on your own floors and see how the numbers come back with VergeSense.
FAQs About Occupancy Analytics
What Is the Difference Between Occupancy Analytics and Occupancy Sensors?
Occupancy analytics and occupancy sensors sit at different layers of the same stack. Occupancy sensors are the hardware that detects presence in a space. Occupancy analytics is the software layer that turns that data, plus WiFi, badge, and booking inputs, into trends, insights, and plans.
How Does Occupancy Analytics Support Lease Decisions?
Occupancy analytics supports lease decisions by replacing assumptions with measured evidence of how space is actually used. Teams can identify under-used floors, right-size before a renewal, and build a defensible cost-per-square-foot case. The biggest savings tend to come from floors you can hand back.
Can Occupancy Analytics Work Without Installing New Hardware?
New hardware isn’t a prerequisite for occupancy analytics. WiFi and badge-based platforms read signals from infrastructure you already have, which makes them fast to deploy. The tradeoff is precision, since these signals resolve at the building or floor level rather than the individual space, so hardware sensors are still important for space-level decisions.
How Do Occupancy Analytics Platforms Handle Multi-Site Portfolios?
Enterprise-ready occupancy analytics platforms unify data across regions and buildings into one view that scales from portfolio down to a single zone. Look for broad integrations and the ability to compare sites consistently. Analytics that work on one floor don't always hold up across a global footprint.
How Long Does It Take to See ROI From Occupancy Analytics?
Time to ROI on occupancy analytics software depends on the decisions in play. Platforms that use existing data can produce first insights within days. ROI often follows the first major space decision, such as a lease exit or consolidation, where avoided real estate cost can reach into the millions.
.jpg)