



Most real estate teams have more occupancy data than they did five years ago, but more data hasn’t made the next decision any easier. Badge swipes, room bookings, and occupancy rates arrive monthly, rolled up by floor and building, and they describe what already happened. The decisions teams are preparing to make are about what happens next.
The next step is turning that data into a real estate decision, a design brief, or stacking plans, which requires different skillsets and information. Occupancy data can get you part of the way to a decision, but planning decisions require additional information: cost per seat, square feet released, capital committed. Connecting the two means knowing which patterns in the data change a decision.
Real estate and workplace teams today need a fast and easy way to connect their unique occupancy trends to high-stakes, high-costs decisions like portfolio right-sizing, space design, neighborhood planning, and more.
Below, we look at what workplace occupancy measures, the challenge in connecting this data to planning decisions,, and how to apply it to your space planning decisions.
Want a benchmark to plan against before your next lease event?
The 10th-edition Occupancy Intelligence Index reports measured utilization across 200+ enterprise customers in 50 countries, so you can see how your own space compares before you commit to a footprint.
What Does Workplace Occupancy Measure?
Workplace occupancy tells you how people actually use your space: which desks and rooms get used, when, and how many people are in them at once.
A monthly average obscures some of the moments that matter. A floor might have 10% average capacity usage two months in a row, but the peaks and other demand trends tell a different story. One month, people spread out across the week. The next, everyone comes in Tuesday through Thursday, the meeting rooms are booked solid by 10 a.m., and the desks sit empty on Mondays and Fridays. The average is the same, but those are two very different floors to plan for.
People often use attendance or capacity as stand-ins for occupancy, but neither tells you the same thing. Attendance, usually pulled from badge data, tells you who came into the building. It doesn’t tell you where they sat or which rooms they used. Capacity is the number of desks and rooms you have on paper, and it stays the same whether the floor is packed or empty.
That distinction matters because every real estate decision is a bet on demand. If you plan around headcount or badge swipes, you’re guessing at how much space people need, and you end up either short on the space they want or paying for space they don’t use. Occupancy is the closest thing you have to a direct measure of demand, so it should be treated as a valuable input for planning decisions.
The Data Sources Behind Occupancy
Take a meeting room booked for 10 people where only two people show up. The booking system will show the room as occupied, even when anyone walking past would be able to see it’s mostly empty. Every data source has blind spots like this, which is why combining a few of them gives you a much more accurate picture.
Five inputs do most of the work:
- Badge access data shows who entered a building and when, which anchors attendance trends at the site level.
- Room-booking systems show intent, including the gap between rooms reserved and rooms actually used.
- WiFi connections give floor-level presence across a whole portfolio without installing new hardware.
- Videoconferencing data shows how meetings split between people in the room and people joining remotely.
- Occupancy sensors measure how individual spaces get used, including desks claimed by a bag or jacket while the person is somewhere else.
None of these tells the whole story on its own. VergeSense starts with the data you already have and brings it into one view. Where there are gaps, we fill them with benchmark data drawn from more than 250 million square feet of real workplace measurement, and add sensors only where you need a direct read that nothing else can give you.
What Makes Occupancy Data Hard to Connect to Planning Decisions
The challenge many teams face today is pulling insights out of the data they’re collecting to make better-informed decisions. Forward-looking planning decisions need to extend the historical trends in last month’s report into something you can take action on: how much space will we need in two years, with the headcount plan finance just approved and an attendance policy leadership is still debating?
There are usually three barriers to connecting your occupancy data to decisions.
The first is that it’s scattered. Badge data can sit with security, WiFi with IT, and room bookings with the workplace team. Each one tells part of the story, and the real estate team making the portfolio call rarely sees them side by side.
The second is taking historical trends and projecting them into the future. A lease decision commits you for the next five to ten years, and it usually has to be made 12 to 24 months before the current lease ends, by which point headcount, policy, and attendance patterns will all have shifted. Last month’s numbers are a starting point, not a forecast.
The third is that the planning work happens somewhere else. Most space plans today are built in a spreadsheet from headcount and a target desk-sharing ratio. If occupancy data shows up at all, it’s as a single average someone types into a cell.
And this is where an average becomes the wrong input for these types of decisions. Whether a floor can take on another team after a consolidation depends on its busiest days and on which kind of space runs out first, desks or meeting rooms. A monthly average smooths both of those away. Answering the question takes a more sophisticated approach that weighs expected demand against the space you actually have, built on occupancy data detailed enough to show the peaks.
Reframing Occupancy Data as a Space Planning Input
Occupancy data is only as useful as the plan it feeds. When it sits next to the headcount forecast and the lease schedule, it shapes the decision. When it sits in a separate report, it mostly gets skimmed. Here’s what building it into the plan looks like for each of the three decisions.
Portfolio Right-Sizing Decisions
Right-sizing is usually where occupancy data can prove ROI fastest, because a lease event puts a date on the decision. If a building is running below capacity for several quarters, you can consider exiting it, consolidating it, or subleasing part of it.
But the average only gets you started. To consolidate, you also need the building’s peak days, which tell you how many people actually have to land somewhere, and the receiving sites’ own peaks, which tell you whether they have room.
A global food manufacturer ran exactly that analysis on a 42,000 sq ft Chicago headquarters and found that they were averaging 5% capacity usage with peaks at 25%. Cutting the footprint by 75% produced $715K in annual cost savings. Employees said the smaller office felt more energized and connected than the near-empty one it replaced.
The same thinking applies when headcount moves. Say a business unit is growing in Denver and shrinking in Atlanta. The HR roster tells you how many people will be in each city. It doesn’t tell you how many will come in, on which days, or what kind of space they’ll use when they do.
Measured occupancy does, and applying those patterns to the headcount plan gives you a demand forecast you can hold up against the space you have in each location. That’s the core of good office space planning: demand and supply in the same plan, instead of one in a report and the other in a spreadsheet
Space Design and Type Decisions
Breaking occupancy down by space type shows which kinds of space people actually need more of and which they don’t. A common pattern: enclosed meeting rooms are full on peak days while open desks meant for focus work sit half empty. A common fix can be fixing the mix of space types on your floor plan, before adding any additional space.
That’s why the most useful number for a design brief is the point where each space type runs out. Predictive Planning can find your employee experience risk threshold: at a given attendance level, how often meeting rooms, phone booths, or desks come up short. Knowing these metrics before you design a new floor plan can inform what to add and what to cut. And because you can run the same analysis on a proposed layout, you can test a design against expected demand before you build it, instead of finding out after move-in.
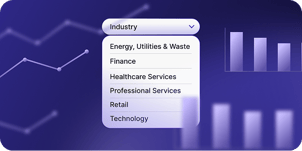
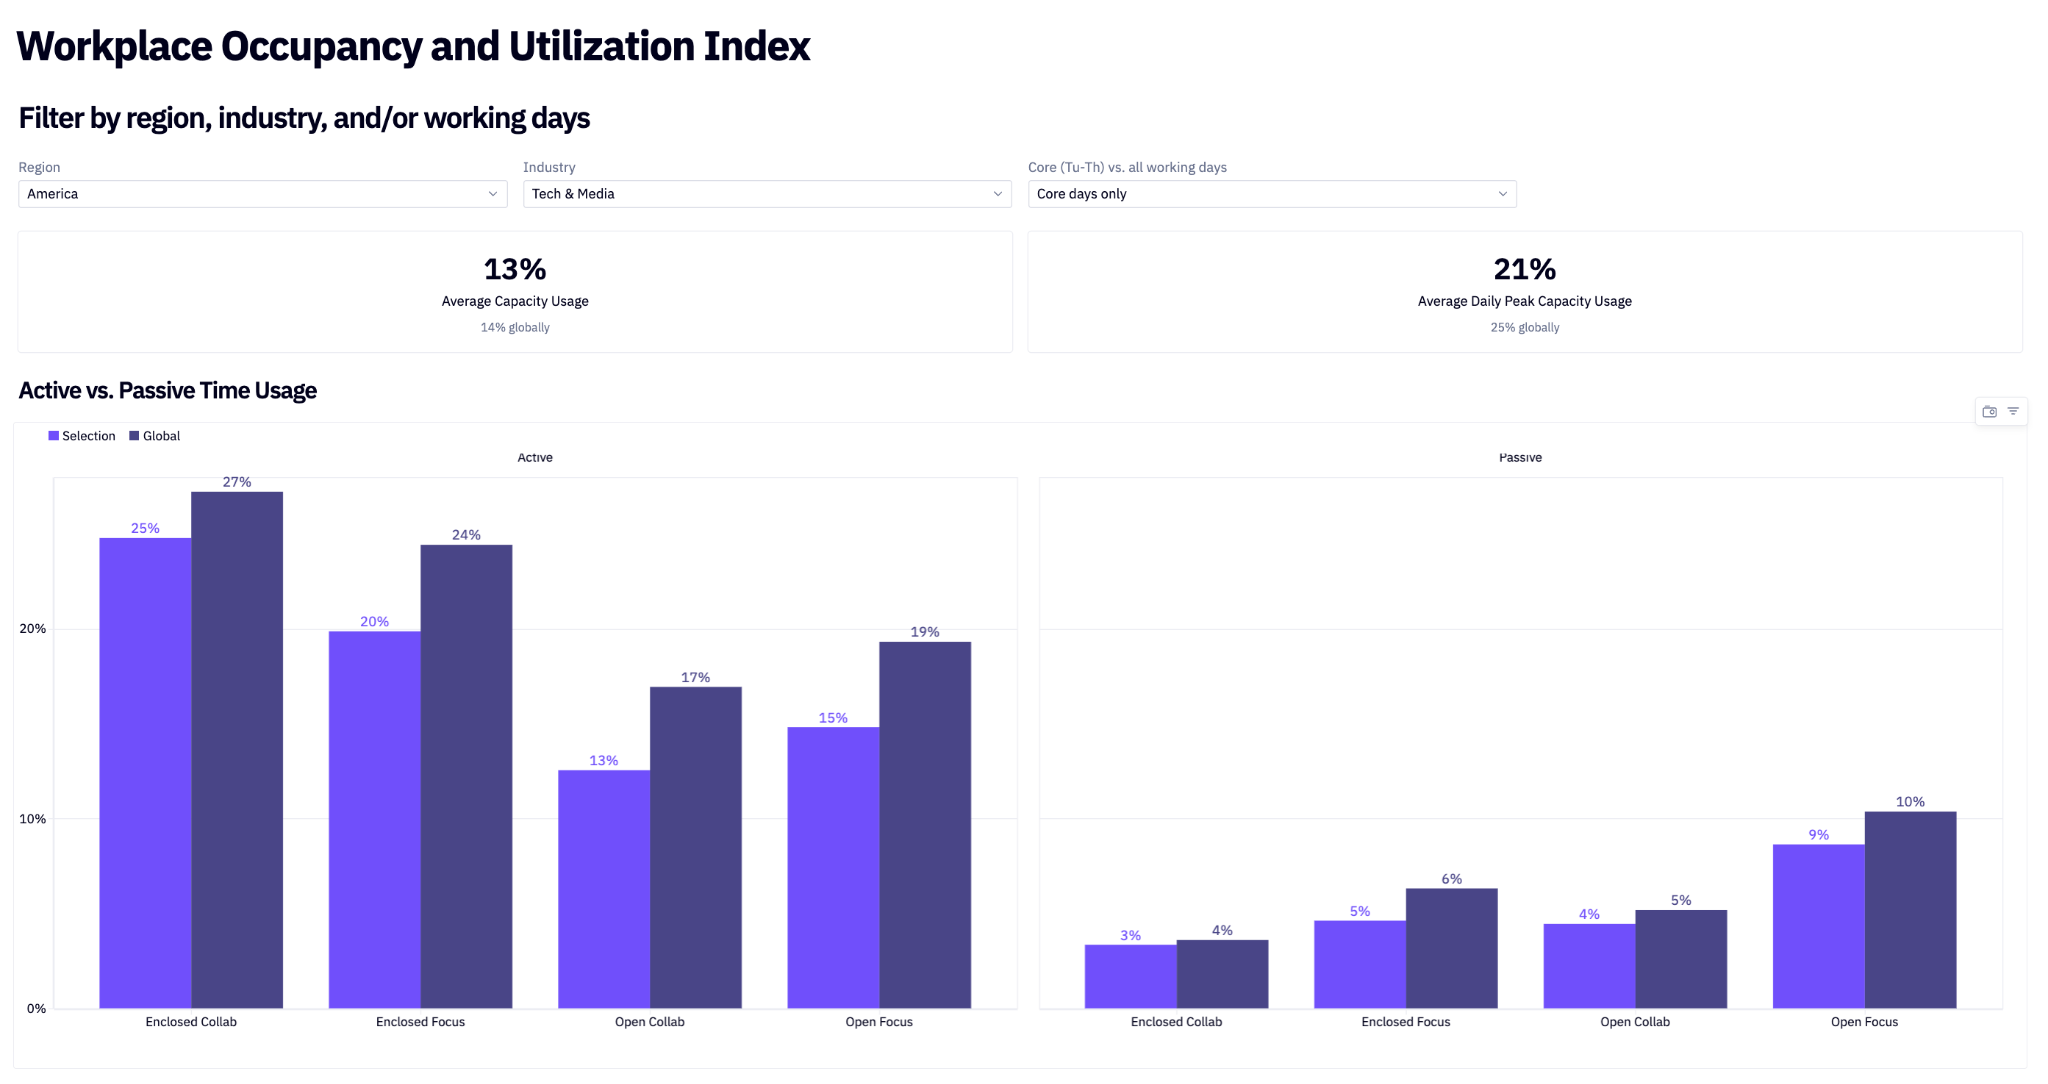
You can explore utilization data by space type, industry, and region in VergeSense’s Occupancy Intelligence Index data, which is a quick way to see whether your own space mix is an outlier before you commit capital.
Neighborhood and Capacity Planning Decisions
Moving a team takes weeks, so the question isn’t whether a neighborhood is crowded today. It’s whether it will be once the proposed changes land. Historical occupancy shows which neighborhoods have slack and which fill up midweek. Combine that with the headcount plan, set a limit for each neighborhood, and you can see which ones will cross it next quarter while there’s still time to move a team.
The same data settles the most common placement request: a team asking for more space. If their neighborhood peaks at 60% on its busiest day, the answer might be a better layout or coordinated in-office days, not more desks. If it’s already running short, you have the evidence to give them room.
Neighborhood planning driven by occupancy data enables teams to evaluate requests for more space, find conference room shortages, and repurpose areas that measurement shows are underused.
What Decision-Driven Space Planning Looks Like in Practice
Here’s how this comes together in Meridian, the VergeSense platform, using a lease decision 18 months out as the example.
Predictive Planning starts with the inputs behind the decision: headcount, how many days a week people come in, and how closely they follow that policy. It blends those with your occupancy history to forecast demand week by week, then lets you compare options side by side, like keeping the floor, giving one back, or moving in a team from another site. For each one, you see how likely each type of space is to run short.
Underneath is the Large Spatial Model, trained on 250M+ sq ft of measured workplace data. Where a building isn’t measured yet, it fills the gap with patterns from comparable spaces, so a floor plan is enough to start. And rather than a single best guess, it evaluates 1,000+ demand scenarios per floor, so you see the range of outcomes.
Workplace Assistant handles retrieval. A planner can ask a question of historical occupancy data in plain language and get the answer back without commissioning a report. A short analysis loop means occupancy questions get asked while the decision is still open.
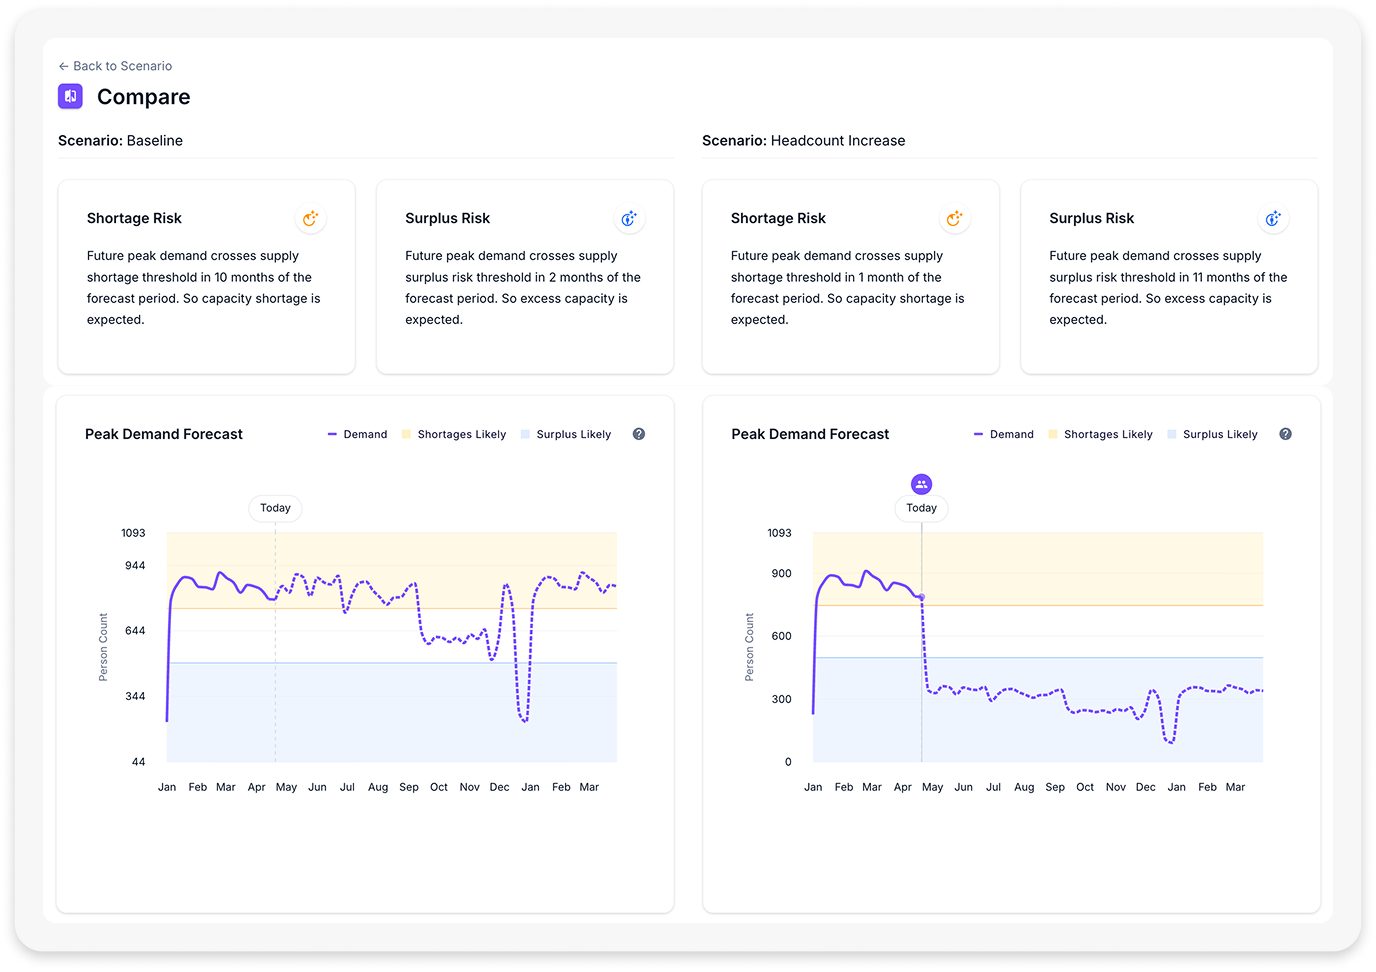
It starts with Occupancy Intelligence, which brings badge, room booking, WiFi, video conferencing, and sensor data into one view, so every plan starts from how your space is actually used. The same data supports each decision in this post: portfolio planning for real estate leaders, design decisions for workplace strategy, experience, and design leaders, and stack planning for occupancy planners.
Put Occupancy Data to Work in Your Next Planning Cycle
Start with what you already collect. Most organizations have badge, room booking, WiFi, and video conferencing data sitting in different systems. What’s usually missing is a way to connect those sources together, with direct measurement added only in the few places they can’t answer the question.
Then pick one decision for that data to inform. A lease renewal 12 to 24 months out is a good first candidate. You probably already have quarters of badge and booking history to work from, there’s time to fill any gaps before the decision is due, and the stakes are high enough that leadership will want evidence behind the call.
From there, bring the data into wherever the plan actually gets made: the scenario model, the stacking plan, or the business case that goes to finance. The goal is for the next version of each to rest on how your space is actually used, not on an assumption. One lease decision made that way will do more to build support internally than a year of dashboards.
Curious how occupancy patterns are shifting across industries and regions?
The 10th-edition Occupancy Intelligence Index covers office space utilization across 250M+ sq ft of workplace data, with benchmark data broken out by industry, region, and day of week.
FAQs About Workplace Occupancy
How Do You Use Occupancy Data for Space Planning?
Start with a decision that’s coming up, like a lease renewal, a redesign, or a team move, and bring occupancy data into the plan for it. Combine your occupancy history with headcount and attendance policy to forecast demand, then compare your options against the space you have. The goal is a plan built on how space is actually used, not on headcount alone.
What Occupancy Rate Should You Plan For?
Plan for your busiest days, not your average. A floor can look half empty on average and still run out of meeting rooms every Tuesday, so the number that matters is the attendance level where your first type of space runs short. To see how your usage compares with peers, the Workplace Occupancy & Utilization Index Explorer breaks it down by industry, region, and day of week.
Can Occupancy Data Replace Employee Surveys for Workplace Strategy?
Workplace occupancy data and employee surveys answer different questions, so occupancy data doesn't replace surveys. Occupancy measures what people did with the space. Surveys explain why they did it and what they'd change. Strong workplace strategy runs both, with occupancy data setting the baseline and survey responses explaining the behavior behind the numbers.