

Office Occupancy Data: What It Is and How to Use It


VergeSense is the industry leader in providing enterprises with a true understanding of their occupancy and how their offices are actually being used.
The 2026 Q1 Workplace Occupancy & Utilization Index found something most real estate leaders suspected but couldn't prove: stricter attendance mandates haven't meaningfully moved attendance.
Instead, demand keeps compressing into the same midweek hours, with peak capacity usage reaching 52 to 60% even as averages sit at 9 to 11%. Stricter policy hasn't been the lever that changes behavior, and forward-leaning organizations are using continuous measurement to make smart decisions.
That shift matters because the old return-to-office framing, the idea that getting people back in the building would resolve itself once the "Great Wait" ended, has expired. What's left is a steady-state hybrid workplace where attendance is genuinely variable week to week, and portfolio decisions built on assumptions instead of data are essentially guesswork.
A lease renewal, a redesign, a headcount move: each one now hinges on whether you can measure how a space is actually used, not how a policy says it should be used.
This piece explains:
- What office occupancy data is
- How it's captured across a portfolio
- How you can turn it into defensible right-sizing, design, and workplace automation decisions
Curious how your portfolio's attendance patterns compare to the broader market?
See how 200+ global enterprises benchmark peak, average, and midweek attendance in the 2026 Workplace Occupancy & Utilization Index.
What Is Office Occupancy Data?
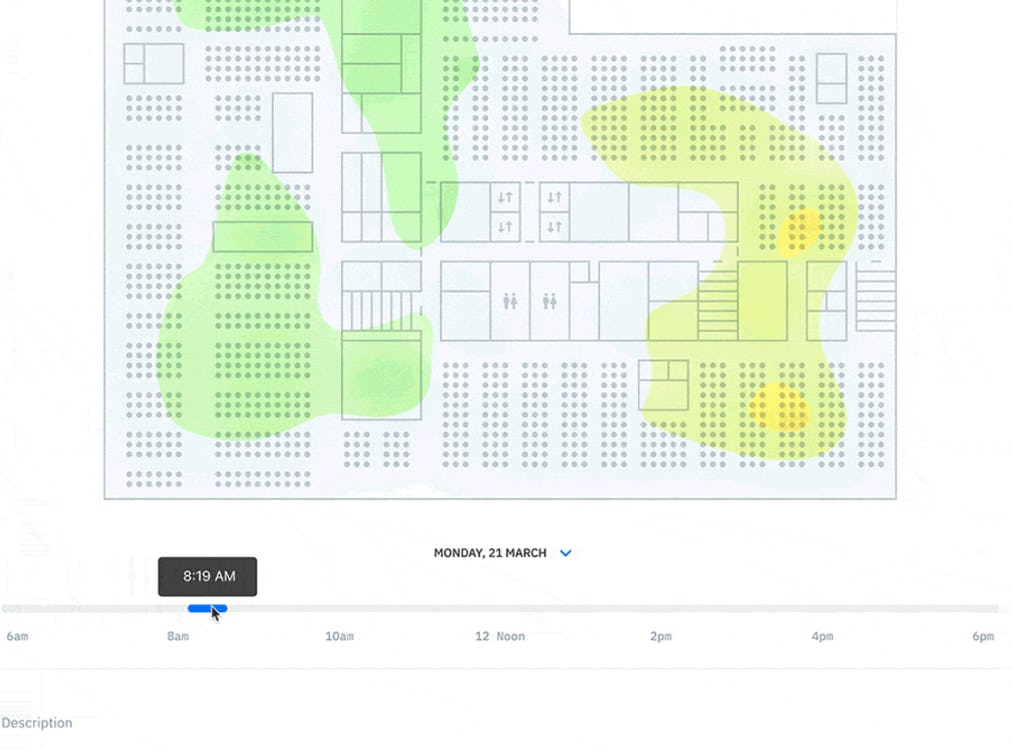
Office occupancy data is the measured record of how many people are present in a space, and where, over time. It's captured continuously, at the portfolio, building, floor, or zone level, rather than assumed from a badge swipe, a booking calendar, or a single walkthrough. That distinction, measured versus assumed, is the whole point.
It's easy to lump occupancy data in with utilization rate, peak versus average person count, and capacity. Those terms describe related but distinct things, and real estate leaders are often handed all four without a clear sense of how they connect.
Below, we cover how occupancy data feeds utilization, peak, and capacity metrics, and why it matters specifically to real estate leaders rather than only facilities teams.
How Occupancy Data Feeds Utilization, Peak, and Capacity Metrics
Occupancy data is the raw input that feeds utilization, peak and average person count, and capacity comparisons. Occupancy data is the number of people in a space at a given moment. Utilization is what you calculate once you divide that count by the space's stated capacity.
Peak and average person count are both derived the same way, just sliced differently across a measurement window. Capacity comparisons only become meaningful once occupancy data gives you a real denominator to compare against a plan. Without continuous occupancy measurement underneath them, utilization rate and capacity planning are just percentages built on someone's best guess.
Why Office Occupancy Data Matters for Real Estate Leaders
Speaking at the 10th Occupancy Intelligence Summit, Gary Gaughan from Indeed's real estate team offered a simple answer to this key question:
"Whether you're retrofitting or whether you're building out, you're spending a hell of a lot of money and you want to feel secure that you're making the best informed decision with the data you have at that time. And if you can have more data, you'll make a better informed decision." - Gary Gaughan, Workplace Data & Planning Manager @ Indeed
For a real estate leader, office occupancy data is the decision input behind every major portfolio call: whether to renew a lease, how much space a redesign actually needs, and whether a floor should expand or shrink. Facilities teams read it too, but the CRE stakes are what make continuous measurement worth investing in.
Measured occupancy turns those calls from a negotiation over opinions into a defensible capital decision. Teams that have it can target design changes to the specific space types running short, rather than defaulting to expansion because no one can prove the existing footprint is enough. That's the difference between reacting to complaints and planning from evidence.
Where Office Occupancy Data Comes From
Getting occupancy data across an entire real estate portfolio requires matching the data source to the value of the space. Building- and floor-level counts don't need the same precision as a boardroom or a lab, so the right approach blends detection methods across a coverage hierarchy: portfolio, building, floor, and individual zone.
Below, we cover the detection methods and data sources that feed portfolio-wide coverage, and what accurate occupancy data actually requires once those sources are combined.
Occupancy Detection and Other Data Sources
At the building and floor level, existing WiFi infrastructure and entryway sensors give a continuous read on how many people are in a location.
Individual high-value spaces, like a boardroom, a lab, or an executive floor, benefit from zone-level detail, which typically comes from an area sensor that can detect people and belongings without depending on someone actively badging in. VergeSense's Infinity Area Sensor is one example of a sensor designed for that job.
Combining these sources gives a real estate team portfolio-wide coverage without paying for area-level precision everywhere it doesn't matter. Badge data, room booking systems, videoconferencing systems, and other existing sensor types can now feed into the same analysis.
The systems that collect that underlying data weren't designed to surface the demand patterns a real estate team actually plans against. That's the gap AI-powered planning tools close. Predictive Planning is VergeSense's approach, using the Large Spatial Model to extract more signal from badge and booking data than the source systems produce on their own.
What Accurate Occupancy Data Requires
Granularity is the first requirement: occupancy data needs to resolve down to portfolio, building, floor, and zone levels, because a decision about one floor shouldn't be made on a building-wide average. Continuous measurement is the second requirement, since a single observation study captures one week's conditions, not the pattern underneath it.
Accuracy thresholds matter too. Entryway sensor and area-level detection typically runs around 95% accuracy, while WiFi-based floor counts run closer to 85%. A real estate leader should know which accuracy level is backing a given decision before committing capital to it.
How CRE Teams Turn Occupancy Data Into Decisions
Right-sizing can get a lot of attention in occupancy data conversations, but it's one use case among several. Once a real estate team has continuous, granular occupancy data supporting portfolio decisions, it opens up design decisions and workplace automation alongside the lease call.
Here, we walk through four of those calls with a case study behind each where one exists: right-sizing and lease cost avoidance, design decisions grounded in occupancy data, workplace automation, and managing capacity and attendance volatility.
Right-Sizing and Lease Cost Avoidance
Right-sizing is the most direct payoff from collecting continuous occupancy data. When measured utilization consistently sits below a building's assumed capacity, you have the evidence to reduce or exit a footprint before the next lease event locks it in for another decade. The bigger the portfolio, the bigger the number attached to that call.
Fresenius Medical Care wanted to consolidate its North American headquarters but didn't have reliable data to make the call with confidence. Manual observation studies and department-leader feedback weren't consistent enough to act on.
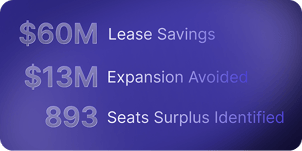
VergeSense occupancy data showed one of its two headquarters buildings was running at only about 20% average utilization. That measurement gave the real estate team the confidence to let the lease on that building lapse rather than renew it, avoiding $6M a year, $60M over 10 years, without any meaningful impact on employee experience.
Design Decisions Grounded in Occupancy Data
Occupancy data reshapes the design questions that used to be made based on assumptions. Meeting-room sizes, phone-booth counts, focus-versus-collaboration ratios, and neighborhood layouts all read differently once measured demand is on the table. A team can rebalance the existing footprint before defaulting to expansion.
A leading Australian grocery retailer's real estate team hired a consultant to plan its two-building portfolio. Working from an HR roster and floor plans, the consultant assumed a 65% on-site rate and recommended leasing additional space to close an 892-desk shortfall.
Predictive Planning analyzed 4.5 months of measured occupancy and found the opposite: the busiest hour saw only 592 people on-site (a 21 to 28% show-up rate), leaving a 178-desk surplus at peak. It also surfaced a room-mix mismatch, with 82% of meetings hosted by two to three people while only 5% of rooms were sized that small.
The fix was rebalancing 50 to 100 people across the existing footprint and re-mixing rooms toward focus space and small meeting rooms. A single strategist ran the analysis in about two hours, avoiding roughly $1.5M in per-floor expansion costs.
Workplace Automation
Occupancy data also feeds automation that recovers space without adding a square foot. Booking data alone measures intent, not attendance, so calendars fill up with meetings that never happen. Pairing booking data with actual occupancy lets a team close that gap automatically: releasing rooms when nobody shows up and freeing capacity for teams that need it.
A management consulting firm's office had a persistent conference-room shortage, and the team was close to leasing another floor to add meeting space. VergeSense occupancy data combined with booking data told a different story: 40% of 10,400 monthly booked hours were ghosted, meaning people booked rooms while traveling and never released them.
Rather than lease more space, the firm deployed VergeSense Space Booking Automation to automatically release booked-but-unattended rooms. That single change eliminated 4,160 hours a month of ghosted meetings and avoided roughly $50K a month in additional leasing costs, without adding a square foot.
Managing Capacity and Attendance Volatility
Occupancy trends, not single snapshots, are what let a team plan for volatility instead of reacting to it. Knowing that peak usage regularly runs well above average, and that demand concentrates midweek, means a real estate leader can size a floor for the pattern that actually happens rather than the average that hides it.
That's a materially different planning exercise than one built around a single point-in-time study. A portfolio sized for its measured peak avoids both the overcrowded Tuesday and the empty Friday, instead of guessing at a number in between.
Office Occupancy Data in the VergeSense Context
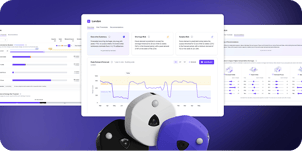
Everything above depends on occupancy data being captured, cleaned, and made usable. Inside the Meridian platform, that's split between two capabilities: Occupancy Intelligence for continuous measurement and analytics, and Predictive Planning for modeling scenarios against that measured baseline.
Predictive Planning runs on the Large Spatial Model (LSM), trained on more than 250M+ sq ft of measured workplace data collected across real, occupied offices. That scale is what lets the model score a proposed floor plan or headcount change against real-world behavior instead of a rules-based assumption about how people should use space.
A biotechnology company's San Francisco headquarters offers a smaller-scale example of the same pattern: occupancy data showed a meaningful share of space was being held passively by belongings rather than active use, prompting added belonging areas that avoided roughly $13M in expansion costs.
Common Pitfalls in Reading Office Occupancy Data
A few habits quietly undermine otherwise good occupancy data programs. Watch for these before they shape a lease or design decision.
- Relying on badge or booking data alone. Badges measure building entry, not desk or room use, and bookings measure intent, not attendance. Both are useful inputs, but neither substitutes for continuous, measured occupancy.
- Treating a one-off study as durable. A point-in-time study captures a single window of conditions. Attendance patterns shift by season, by team, and by policy change, so a study from a year ago may already be stale.
- Confusing bookings with actual usage. A booked room isn't necessarily an occupied one, as the ghosted-meetings pattern above shows. Measuring actual presence, not reservation status, is what catches the gap.
- Ignoring peak versus average. A floor that looks comfortably under-occupied on average can still fail its busiest Tuesday. Planning to the average alone sets a portfolio up to be blindsided at exactly the moment it matters most.
How to Get Started With Analyzing Office Occupancy Data
Start by baselining current usage across the portfolio rather than any single building. A few months of continuous, granular data will surface the peak, average, and midweek patterns that a policy change or a single walkthrough never will.
From there, match data sources to space value: WiFi and entryway sensors for broad building and floor coverage, area-level sensing for the boardrooms, labs, and other spaces where the cost of getting it wrong is highest. That coverage approach is what makes the data defensible when it's time to build a right-sizing case for leadership.
The strongest right-sizing cases lead with the measured number. Whether that's a utilization figure that supports a lease exit, a room-mix finding that supports a redesign, or a ghosted-meeting figure that supports automating bookings, the case is only as strong as the data underneath it.
Want to see how your portfolio's occupancy data compares before your next planning decision?
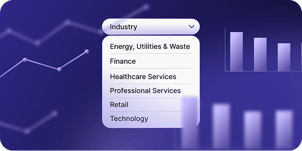
Use the Index Explorer to filter measured utilization from 200+ enterprises by industry, region, and day of week.
Explore the Data →
FAQs About Office Occupancy Data
How Is Office Occupancy Data Measured?
Office occupancy data is measured through detection methods like collecting data from WiFi infrastructure and entryway sensors for building- and floor-level counts, and dedicated area sensors for individual zones. Continuous measurement over weeks or months produces reliable peak, average, and utilization figures, unlike a single point-in-time study or badge and booking data alone.
What Is a Good Office Occupancy Rate?
A good office occupancy rate depends on whether a space is sized to its measured peak or its assumed average. The 2026 Q1 Index shows average utilization sitting around 9 to 11% with peaks reaching 52 to 60%, so there's no universal target. Compare your own numbers against current benchmarks before judging a figure in isolation.
How Often Should Occupancy Data Be Collected?
Occupancy data should be collected continuously. A one-off study captures a snapshot that goes stale as soon as attendance patterns, policies, or team composition shift. Continuous measurement is what lets a team catch midweek compression, seasonal shifts, and emerging shortages before they force a reactive decision.
Can Office Occupancy Data Reduce Real Estate Costs?
Office occupancy data can reduce real estate costs by supporting lease exits, redesigns that avoid expansion, and automation that recovers space without adding square footage.