

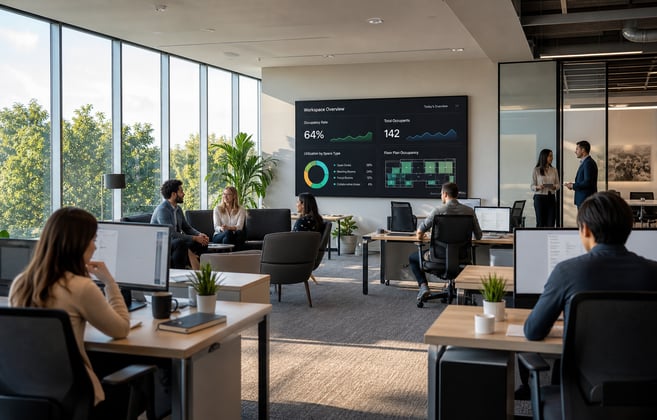

For years, running an office space utilization study meant hiring a consultant, scheduling a two-week walk-through, and waiting for a static report that aged the moment it landed. The clipboard-and-badge-swipe era produced snapshots, not patterns, and the decisions that followed were only as good as the slice of time they captured.
That's changing. Continuous sensor data, integrated analytics, and AI trained on millions of square feet of measured workplace data now let teams run utilization studies that update in real time, surfacing the patterns manual methods miss.
This guide walks through:
- How to run a utilization study that produces actionable data
- What the numbers actually show when you do
- How platforms like Meridian, The Workplace AI Platform, compress weeks of analysis into hours
Want to see how your utilization data compares to 210+ enterprises from across 50+ countries?
Explore space-type utilization, peak demand patterns, and shortage rates in the interactive VergeSense Index Benchmark explorer.
What Is an Office Space Utilization Study?
An office space utilization study is a structured assessment of how physical workspace is actually used, measured against its designed capacity. It goes beyond headcount, drawing on occupancy intelligence to show which spaces are occupied, when they're occupied, and whether the mix of space types matches the work happening inside them.
A simple occupancy count tells you how many people entered a building on a given day. A utilization study tells you whether those people had the right spaces to do their work, which areas sat empty, and where demand exceeded supply.
It's the difference between knowing a floor was "used" and knowing which specific space types on that floor were overbooked, underused, or misallocated.
Why Traditional Utilization Studies Fall Short
Point-in-time snapshots miss the patterns that drive decisions. Badge data shows who entered the building, not which floors or space types they used. A two-week consultant walk-through captures a single slice of behavior that may not reflect seasonal variation, midweek concentration, or meeting cadence.
Consider a global banking firm whose workplace team knew spaces weren't being used effectively — but lacked the granular data to understand why.
A 90-day VergeSense utilization study revealed the answer: collaboration spaces and flexible workstations were being used almost equally, because employees were seeking privacy, not collaboration.
Three targeted design changes later, the firm improved usage of its existing footprint and saved $280K a year; a fraction of what a full redesign would have cost.
How to Run an Office Space Utilization Study
The steps below outline a methodology for workplace and real estate teams running a utilization study from scratch.
Each step can be executed manually, but platforms that automate data collection and analysis compress the timeline from months to hours. The difference between a study that stalls in a slide deck and one that drives a lease decision often comes down to how these steps are sequenced.
Step 1: Define the Questions the Study Needs to Answer
Every utilization study starts with a business question. Are you right-sizing a portfolio for a lease renewal? Redesigning a floor to support hybrid work? Evaluating whether to expand or consolidate?
This question shapes the methodology and the data you'll need.
A right-sizing study needs portfolio-wide occupancy trends over time, while a redesign study needs space-type-level data on how different zones perform throughout the week. An expansion evaluation requires demand forecasting that accounts for growth projections and hybrid attendance patterns.
Define the decision first, then choose the data sources that inform it.
Step 2: Choose Your Data Sources
Five canonical data sources feed most utilization studies: badge access data, room-booking systems, WiFi connections, videoconferencing data, and occupancy sensors.
Each source measures something different, and each has limitations.
- Badge data shows building entry but not space-level utilization.
- Room-booking systems reveal scheduled usage but not actual attendance (ghosted meetings are a well-documented gap).
- WiFi connections indicate device presence at floor level with roughly ~85% accuracy, while occupancy sensors deliver area-level measurement at roughly ~95%.
- Videoconferencing data captures in-room participation, but the open question is everywhere else: desks, open collaboration areas, and the rooms with no device in them.
Reconciling multiple sources manually is where most studies lose time. Occupancy intelligence platforms that ingest all five sources into a single analytics layer compress this step significantly.
For example, VergeSense Occupancy Intelligence unifies these data streams so teams can skip the spreadsheet reconciliation and move directly to analysis.
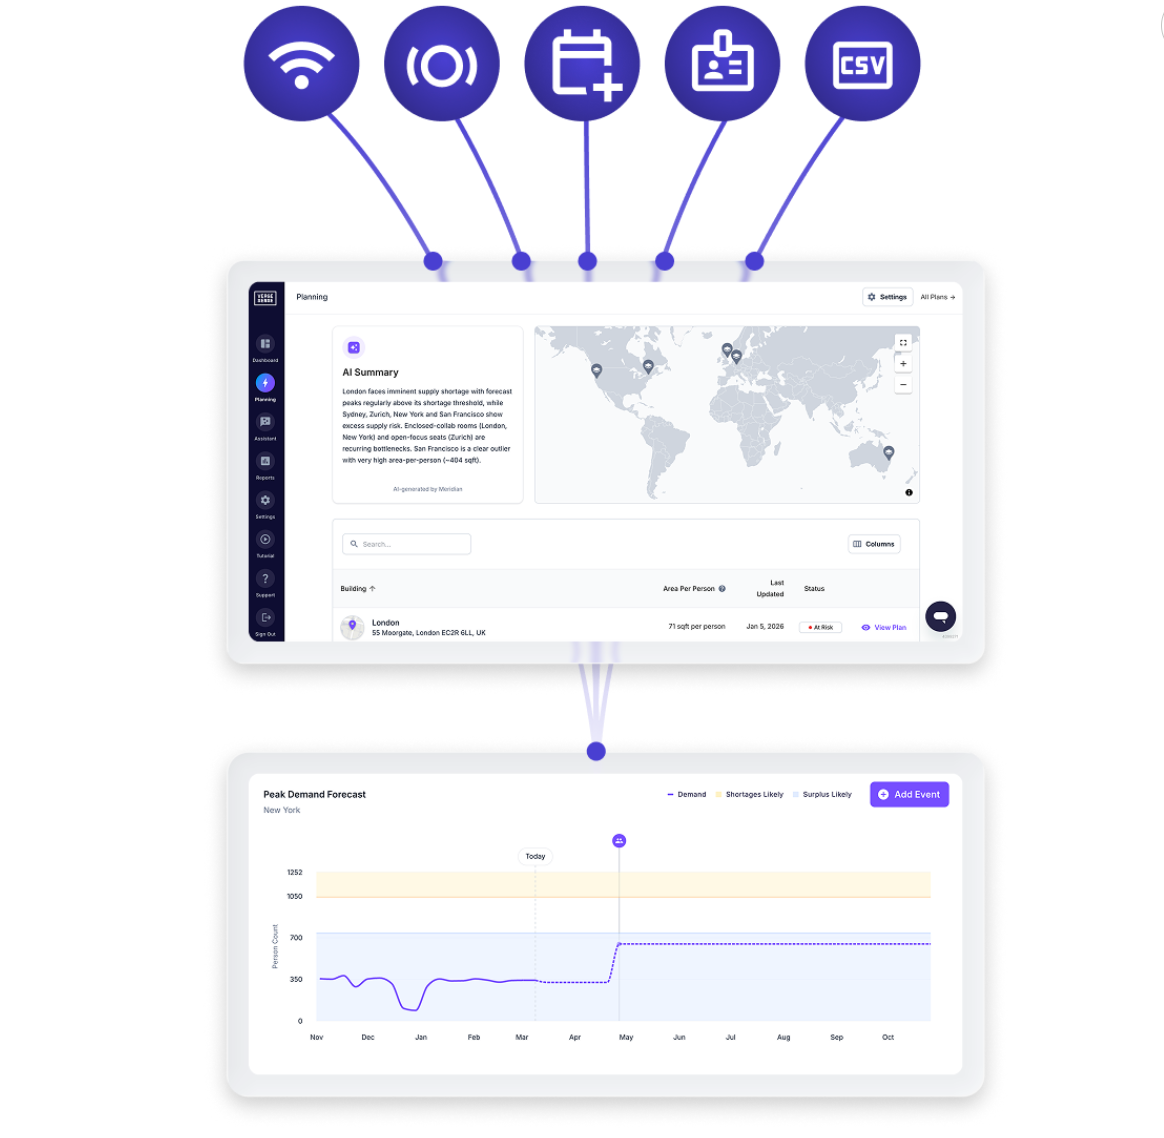
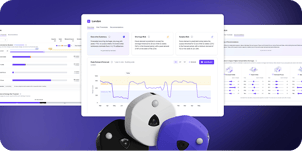
VergeSense’s Meridian Platform unifies all your data sources into a single analytics layer.
Step 3: Set a Measurement Window
A two-week snapshot won't reveal the patterns that matter. Teams need 8 to 12 weeks minimum to capture seasonal variation, midweek concentration, and meeting cadence. Shorter windows risk building strategy around an anomalous period.
If your organization has hybrid policies that vary by team or quarter, extend the window to cover at least one full policy cycle. The measurement window determines whether your findings reflect real patterns or noise.
Step 4: Analyze by Space Type, Not Just Total Square Footage
Total building utilization is a starting point, but it hides the supply-demand mismatches that drive the most consequential decisions. Breaking utilization down by space type, including enclosed collaboration, open focus, meeting rooms, and shared desks, reveals the real picture.
The VergeSense Workplace Occupancy & Utilization Intelligence Index, which tracks patterns across 210+ enterprises in 50+ countries, illustrates why this matters. Enclosed collaboration spaces show an 18% shortage at 2 PM. Enclosed focus areas make up 8% of the average footprint while running at 77% occupied capacity. Open focus areas account for 69% of space at 85% capacity.
Space-type breakpoint analysis is where most teams get stuck. Platforms that automate this analysis shorten the study timeline from weeks to days. Meridian runs this analysis automatically once sensor data starts flowing.
Step 5: Translate Findings Into a Decision Framework
A utilization study only creates value when findings map to a specific decision: a lease exit, a floor consolidation, or a space-type reconfiguration. Static utilization reports tend to stall in committee because they describe conditions without modeling outcomes.
The study's value isn't the data itself, but whether that data translates into modeled scenarios leadership can act on.
Planning tools that let teams run consolidation or reconfiguration scenarios directly from study data close this gap. In the case of VergeSense, Predictive Planning uses the Large Spatial Model to forecast how changes to space mix, headcount, or policy will affect utilization before any physical change is made.
What Utilization Data Actually Shows
When teams run their first comprehensive utilization study, a few findings consistently surprise them. The VergeSense Occupancy Intelligence Index, drawing from 1,400+ sites across 20+ industries, captures these patterns at portfolio scale.
Average Utilization Is Lower Than Expected
Across the VergeSense Index average utilization runs between 9% and 11%. That number shocks most leaders, but it reflects the gap between designed capacity and actual daily presence across the full work week. Even buildings that feel busy during peak hours carry significant unused capacity when measured continuously.
Peak Demand Concentrates Midweek
The Tuesday-through-Thursday crunch is real and measurable. Most portfolios see peak utilization reaching 52% to 60% during this midweek window, with Monday and Friday running significantly lower. This has direct implications for space sizing: designing for peak means overbuilding for roughly 40% of the work week.
Understanding this pattern changes the conversation from "do we have enough space?" to "do we have enough space on the days it matters, and can we reclaim it on the days it doesn't?"
Space-Type Mismatches Are the Real Problem
Total square footage may be adequate while specific space types are in chronic shortage or surplus. A building with plenty of open desks but not enough enclosed collaboration rooms will feel crowded to the teams that need to meet, even if overall utilization looks low.
This is why total-building metrics alone don't drive portfolio decisions. The space-type breakdown is where actionable findings live, and it's the layer most manual studies struggle to produce. Continuous measurement makes this level of analysis practical at portfolio scale.
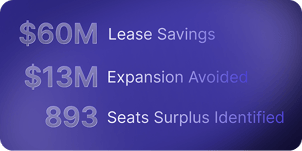
$13M in Annual Expansion Costs Avoided: Biotechnology Company Uncovers Passive Occupancy ChallengeA biotechnology company headquartered in San Francisco was preparing to expand its campus to accommodate growing teams under an unassigned seating policy. The assumption was straightforward: more people meant more space. Before committing capital, the workplace team deployed VergeSense sensors to understand how existing space was actually being used. The data revealed something manual surveys had missed: spaces were being held passively by personal belongings rather than actively occupied by people. Desks with a laptop bag or jacket draped over a chair registered as "taken," blocking other employees from using them, even when the person was elsewhere in the building. Rather than building new space, the team added designated belonging areas, freeing up existing workstations and eliminating the passive-occupancy bottleneck. The result was $13M per year in avoided expansion costs, achieved by changing behavior and space design instead of adding square footage. |
How to Start an Office Space Utilization Study
Running a utilization study doesn't require a six-figure consulting engagement or a year-long timeline. It starts with three practical steps:
- Identify the business question you need to answer
- Audit the data sources already available in your organization
- Set a measurement timeline of at least 8 to 12 weeks
For teams that want to move faster, VergeSense Occupancy Intelligence provides the analytics layer that unifies badge, booking, WiFi, videoconferencing, and sensor data into a single view.
Once the data is flowing, Predictive Planning models scenarios from study findings so leadership can evaluate lease exits, consolidations, and reconfigurations before committing capital. Teams don't need to wait for a final report to start running "what if" analyses.
Running a utilization study of your own?
Benchmark your findings against the largest workplace occupancy dataset in the world, drawn from 250,000+ spaces across 50+ countries.
FAQs About Office Space Utilization Studies
How Long Does an Office Space Utilization Study Take?
A meaningful study requires 8 to 12 weeks of data collection to capture weekly patterns, seasonal shifts, and meeting cadence. Manual studies often take longer due to data reconciliation. Platforms with continuous sensor data can deliver initial findings within days of deployment and deepen accuracy as the measurement window extends.
What Is a Good Utilization Rate for Office Space?
There's no universal target because "good" depends on space type and organizational context. The VergeSense Workplace Occupancy & Utilization Index shows average utilization across 210+ enterprises at 9% to 11%, with midweek peaks reaching 52% to 60%. A rate that looks low at the building level may be perfectly healthy when broken down by individual space types and measured against actual demand.
Can a Utilization Study Replace a Consultant Engagement?
A sensor-driven utilization study can replace the data-collection phase of a consultant engagement, often with more accurate and continuous results. Many organizations still work with consultants for strategic advisory and change management, but now bring their own occupancy data to the conversation rather than relying on consultant-collected snapshots. The combination of continuous data and consultant expertise tends to produce stronger outcomes than either approach alone.
How Often Should Utilization Be Measured?
Continuous measurement is the standard for organizations with hybrid or evolving work policies. Patterns shift with seasonal cycles, policy changes, and headcount fluctuations. A one-time study provides a baseline, but ongoing measurement ensures decisions stay grounded in current behavior rather than aging snapshots. Organizations with active lease negotiations or space redesign programs benefit from reviewing utilization data at least quarterly.