


|
Field |
Value |
|
Series label |
The 10th Index, Part 1 of 3 |
|
Slug |
/resources/blog/why-is-the-office-still-built-for-working-alone |
|
Meta description |
77% of measured office space is built for solo work, but people now split their week evenly. Here's why office planning fell behind, from VergeSense's 10th Index. |
|
Target query |
Why are offices still designed for individual work? |
Somewhere in your portfolio this morning, a floor reads healthy on every metric you collect. Meanwhile, an employee walks its corridors and can't find a meeting room. Both are true at the same time. The data says there should be space available, but the person genuinely can't find any.
That gap is what VergeSense's 10th Workplace Occupancy & Utilization Index measures. It draws on a year of measured occupancy across 250M+ square feet, plus a year of forecasted demand modeled across thousands of floors, from July 2025 to July 2026. This is Part 1 of 3.
Key takeaways
- 77% of the office floor area VergeSense measures is built for solo work: 69% open focus (desks) and 8% enclosed focus rooms.
- US office workers now spend 40% of the week working alone and 40% collaborating in person, according to Gensler's 2024 Global Workplace Survey. In 2013 the split was 54% and 17%.
- Hybrid work and AI both pulled solo, heads-down work out of the office. The space allocation inside it never changed.
- Planners know desks aren't what runs out. They keep requesting desks because desk count is what gets funded.
Why Are Offices Still Designed for Individual Work?
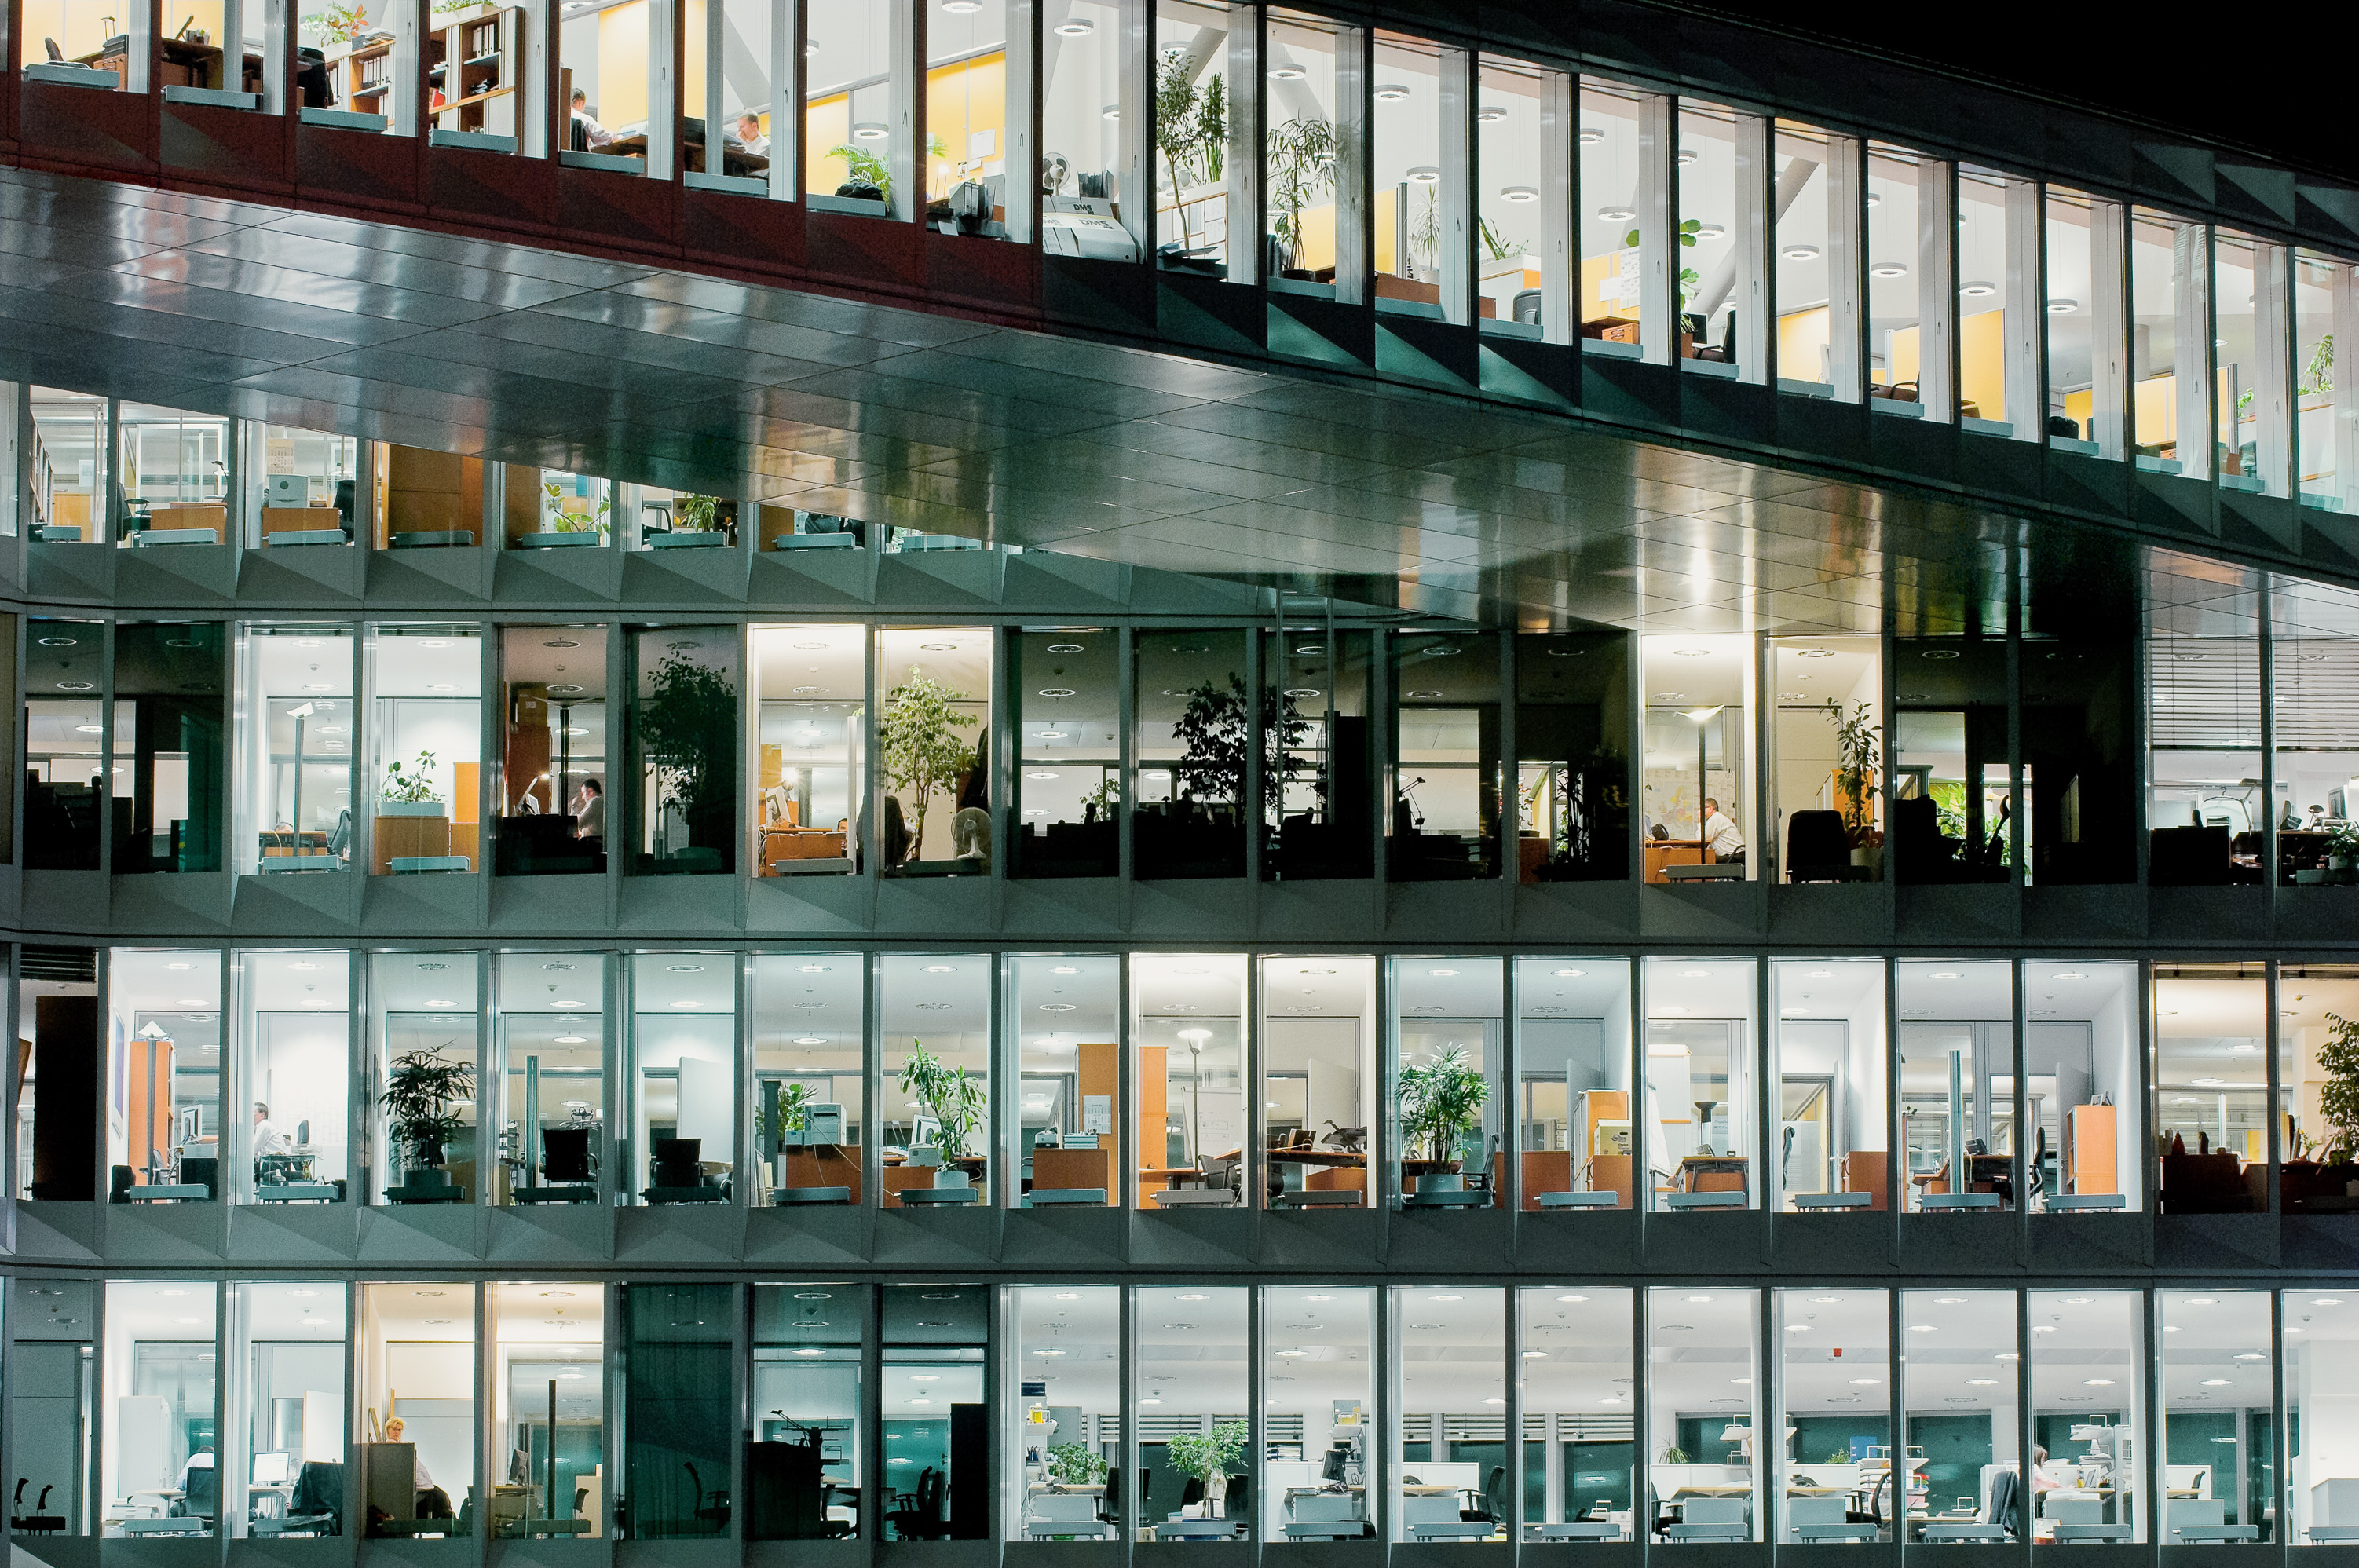
Offices are still designed for individual work because space planning still runs on a decades-old formula: headcount times a show-up rate equals a number of desks. That formula worked when work was mostly solo. Today, 77% of the floor area VergeSense measures is built for working alone, for a workforce that spends only 40% of its week doing it.
Your building was drawn for a week that people had already stopped having. The rest of this piece explains how that happened, and why the people who plan offices haven't been able to fix it.
How Did Office Space Planning Work Before Hybrid?
For about fifty years, office space planning was an arithmetic exercise, and it worked. You took headcount, applied a show-up rate, and got a number of desks. Everything else followed from that number. The model held because behavior was steady and every employee had one assigned workspace.
The ratio tightened steadily over those decades:
- In the 1970s, companies planned for 500 to 700 square feet per worker, according to the Los Angeles Times.
- By 2010, the average was 225 square feet. By 2012, it was 176, according to CoreNet Global figures reported by TIME. CoreNet Global expected 151 square feet by 2017.
- In a 2012 CoreNet Global benchmark survey, 40% of corporate real estate managers expected average space per worker to fall to 100 square feet or less within five years.
- IFMA published square-foot allocations by job title, so a person's title told you how much space they were owed.
CBRE describes the pre-COVID model plainly: one workspace per person, a typical 70% average show-up rate, and little daily variation beyond vacation, sick leave, and travel. Headcount growth was a number you multiplied. The office was a container you sized to hold the result.
When Did Collaboration Start Overtaking Solo Work?
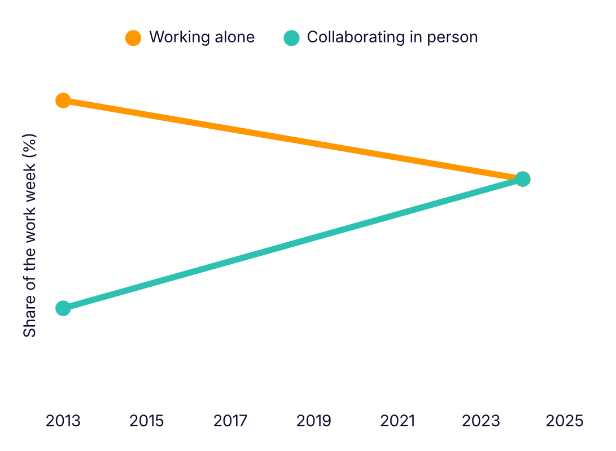
The shift toward collaboration started more than three decades ago, long before 2020. By 1991, 51% of office workers said they had areas where they could meet and talk informally, up from 46% two years earlier, according to Steelcase research. By 2024, US office workers split their week evenly: 40% working alone and 40% collaborating in person.
In that same 1991 Steelcase data, 57% said dedicated project areas were available to them. Workers still spent more than half their time working alone, but their organizations were already building toward more collaborative work. The pull toward collaborative space was underway before most of the floor plans in your portfolio were drawn.
Gensler tracked the same trend to its conclusion. In 2013, US office workers spent 54% of the week working alone and 17% collaborating in person, according to the Gensler U.S. Workplace Survey 2019. By 2024, the two figures had met at 40% each, which Gensler's Global Workplace Survey 2024 noted as a first.
How Much of Today's Offices Are Built for Solo Work?
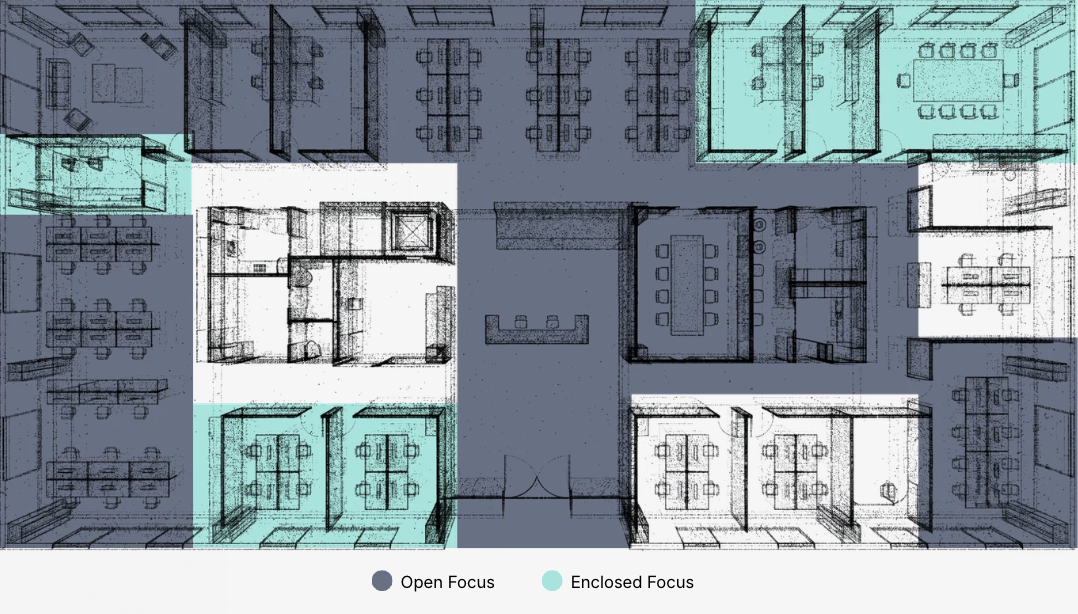
In VergeSense's 10th Index dataset, 77% of measured office floor area is built for solo work. Open focus space (desks, benches, and pods) accounts for 69% of floor area, and enclosed focus rooms (private offices and phone booths) add another 8%. That leaves less than a quarter of the floor for the collaboration people now come in for.
Planners kept relying on space-planning ratios built for how people used to work. The gap between behavior and those ratios widened lease over lease. Most footprints carried enough slack to absorb the error, so it didn't surface. Then the slack ran out, and an industry that had watched a gradual change for three decades sounded the alarm about a sudden one.
Want to see how your floors compare?
See how VergeSense helps workplace teams find where their space mix no longer matches how people work, and pinpoint what changes can help you get there.
What Changed the Purpose of the Office?
Two things changed around the office: hybrid schedules and AI. Both moved solo work somewhere other than a desk in the building, and neither moved the desks.
What the In-Office Day Is Spent On
Hybrid moved a share of working days out of the office, and the days that stayed changed character. Heads-down work migrates to home days, and the days people come in get spent with other people. Ask CRE leaders what the office is for now and 70% name collaboration and knowledge exchange, against 27% who name enabling productivity.[Leesman]
What AI Is Being Used For
AI use at work is now widespread and concentrated in solo work. 74% of frontline employees are regular users, up 23 percentage points in a year, and 42% of regular users save at least a full workday a week.[^BCG] When Microsoft classified 105,000 Copilot conversations, 81% fell into individual, heads-down categories.[^MSFT]
Put those together, and the reason to be in the building is now the thing the building has least of.
Why Do Planners Keep Requesting Desks?
Planners keep requesting desks because desk count is what finance approves, even when planners know desks aren't what runs out. Over enough budget cycles, the building gets shaped by what is fundable rather than what behavior shows is needed. Collaboration space is the first thing cut, because desk count is the number that gets defended.
A workplace design and real estate planning lead at a global software company described it to VergeSense this way:
"Desks are my seventh most used space type, and therefore they're not the highest demand for what I need to be putting in."
"Because the lever for approval is still based on workstations, there's a reluctance to go all in on non-workstations."
"The stuff that we get approval on is truly bulletproof desk capacity."
When the desk count has to rise, something gives way to make room for it:
"140-person neighborhoods now. That wasn't how it was designed. That's what happens when they keep running out of room. They're like, okay, well, we don't need this furniture, that's just collaboration."
The shortage surfaces late, when it is hardest to fix:
"You'll never hear 'I don't have enough conference rooms' until the day they move in, and they're like, what did you put us in?"
Why Can't Headcount Ratios Plan a Hybrid Office?
Headcount ratios can't plan a hybrid office because they only return a number of desks. They can't tell you which teams arrive on the same day, which rooms run out at 2 PM, or how close a floor is to the point where people can't find somewhere to work. The formula was built for a workforce that came in, sat dparown, worked, and left.
So the industry handed workplace teams a policy debate instead: three days or four, which teams, which days. It's a fair question. But it takes for granted that the office people are coming back to is still shaped for the work they come back to do.
The question nobody is asking is whether the building still fits the way people now work. Part 2 answers it with a year of data.
Planning a restack, renewal, or redesign this year?
See how Meridian, The Workplace AI Platform, uses the Large Spatial Model, trained on 250M+ square feet of workplace behavior, to show what your floors actually need.
FAQs About Office Space Planning and Solo Work
What Percentage of Office Space Is Built for Individual Work?
About 77% of measured office floor area is built for individual work, according to VergeSense's 10th Workplace Occupancy & Utilization Index (July 2025 to July 2026). Open focus space such as desks accounts for 69%, and enclosed focus rooms such as private offices and phone booths account for 8%.
How Much Time Do Office Workers Spend Collaborating?
US office workers spend about 40% of their week collaborating in person and 40% working alone, according to Gensler's Global Workplace Survey 2024. In 2013, the split was 17% collaborating and 54% working alone, per the Gensler U.S. Workplace Survey 2019.
How Has Square Footage Per Office Worker Changed?
Square footage per office worker fell from 500 to 700 square feet in the 1970s to 225 in 2010 and 176 in 2012, according to CoreNet Global figures. Planning still relied on ratios like these well after hybrid work changed how often, and why, people use the office.
Why Is AI Reducing Demand for Desks?
AI reduces demand for desks because it absorbs individual, heads-down work. In Microsoft's analysis of 105,000 Copilot conversations, 81% of AI usage was individual work. BCG found 42% of regular AI users save at least a full workday per week. Less solo work means fewer hours spent at a desk.
Sources
- VergeSense, 10th Workplace Occupancy & Utilization Index, measured dataset, July 2025 to July 2026.
- Los Angeles Times, December 15, 2010. Also cited in Vanity Fair, May 2020.
- Justin Worland, "The Incredible Shrinking Office," TIME, February 23, 2015, reporting CoreNet Global figures.
- CoreNet Global benchmark survey, February 2012 (465+ corporate real estate managers).
- IFMA, Space and Project Management Benchmarks, Research Report #34, as reported in Facility Executive, February 20, 2013.
- CBRE, "The Math Behind the Hybrid Workplace," January 11, 2024.
- Steelcase, "The Privacy Crisis," 360 Magazine, 2017, reporting 1991 survey data.
- Gensler, U.S. Workplace Survey 2019.
- Gensler, Global Workplace Survey 2024.
- Gensler, 2026 workplace survey [add full title].
- Leesman, CRE leader poll, 2025.
- BCG, AI at Work, 4th edition, June 2026 (n=11,749 across 14 markets).
- Microsoft Work Trend Index, classification of 105,000 Copilot conversations, February 2026.