
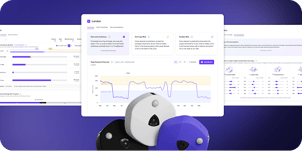




Most office utilization dashboards can show you how many rooms were booked and how many badges were swiped. Far fewer can tell you who actually showed up and which spaces they occupied. Your dashboard needs to give you insights that support confident planning decisions, like:
- Actual versus scheduled occupancy: whether the people who reserved a space actually used it
- Passive occupancy: space held by a bag, a jacket, or an open laptop while its user is elsewhere
- Space-type performance: how desks, focus rooms, and collaboration zones each support demand
- Peak versus average utilization: the busiest hours you have to design for, not the daily average
You should ask any platform you evaluate to show you all four. But don’t expect to get all the answers from a dashboard. Their value lies in their ability to support decisions with the data they provide.
This article explains when you need an office utilization dashboard, as well as what most dashboards show, what they miss, and what they should actually include. It also covers how to evaluate solutions and how VergeSense surfaces what booking-based dashboards can't.
Do You Need an Office Utilization Dashboard?
Teams usually start evaluating utilization levels ahead of a lease renewal, or when finance sets a target for cutting real estate costs. An office utilization dashboard provides evidence to support that decision.
This is something to keep in mind throughout vendor evaluations. Almost every platform will demo well, but you should be more interested in what a dashboard can tell you than how it looks. Ask what types of decisions it can help you confidently make, whether that’s right-sizing, design, occupancy planning, or day-to-day operations.
Platforms in the office space utilization software category split into booking-led tools, WiFi analytics, IWMS suites, and occupancy intelligence. Plenty of tools in a workplace stack produce something that looks like a dashboard. Desk booking interfaces show reservations, and building management panels show energy draw and HVAC load, but none of these record whether anybody actually used the space.
What Most Office Utilization Dashboards Show (and What They Miss)
Standard dashboard inputs include room bookings, badge swipes, and calendar data from the meeting system. But each of these records an intention rather than an outcome.
A booking says somebody reserved the room, and a badge swipe says somebody entered the building. But neither says anything about how many of the seats were filled or whether the meeting happened at all.
Bookings can overstate usage when rooms get held and abandoned, and they can understate it when people take an open seat without reserving anything. Badge data has a similar issue at building scale, counting an entry the same way whether somebody stayed for one meeting or the full day.
Booking and badge feeds also leave out space-type performance. As a result, a floor can read as healthy while its enclosed focus rooms run near capacity and its open collaboration zones sit idle.
The 10th edition of our Workplace Occupancy & Utilization Index found that enclosed collaboration space accounts for roughly 84% of the people left without a seat, while desks don’t run out until the floor is about 75% full. Booking and badge feeds report the floor as a whole, so neither threshold shows up in them.
Many teams still fill the gap with point-in-time office space surveys, which capture employee experience a dashboard can't. But these often become outdated between studies.
Whatever feeds the dashboard, judge it on the decision you need it for. Renewing a floor needs a building-level read, while deciding what to build on that floor needs space-type data.
What an Office Utilization Dashboard Should Surface
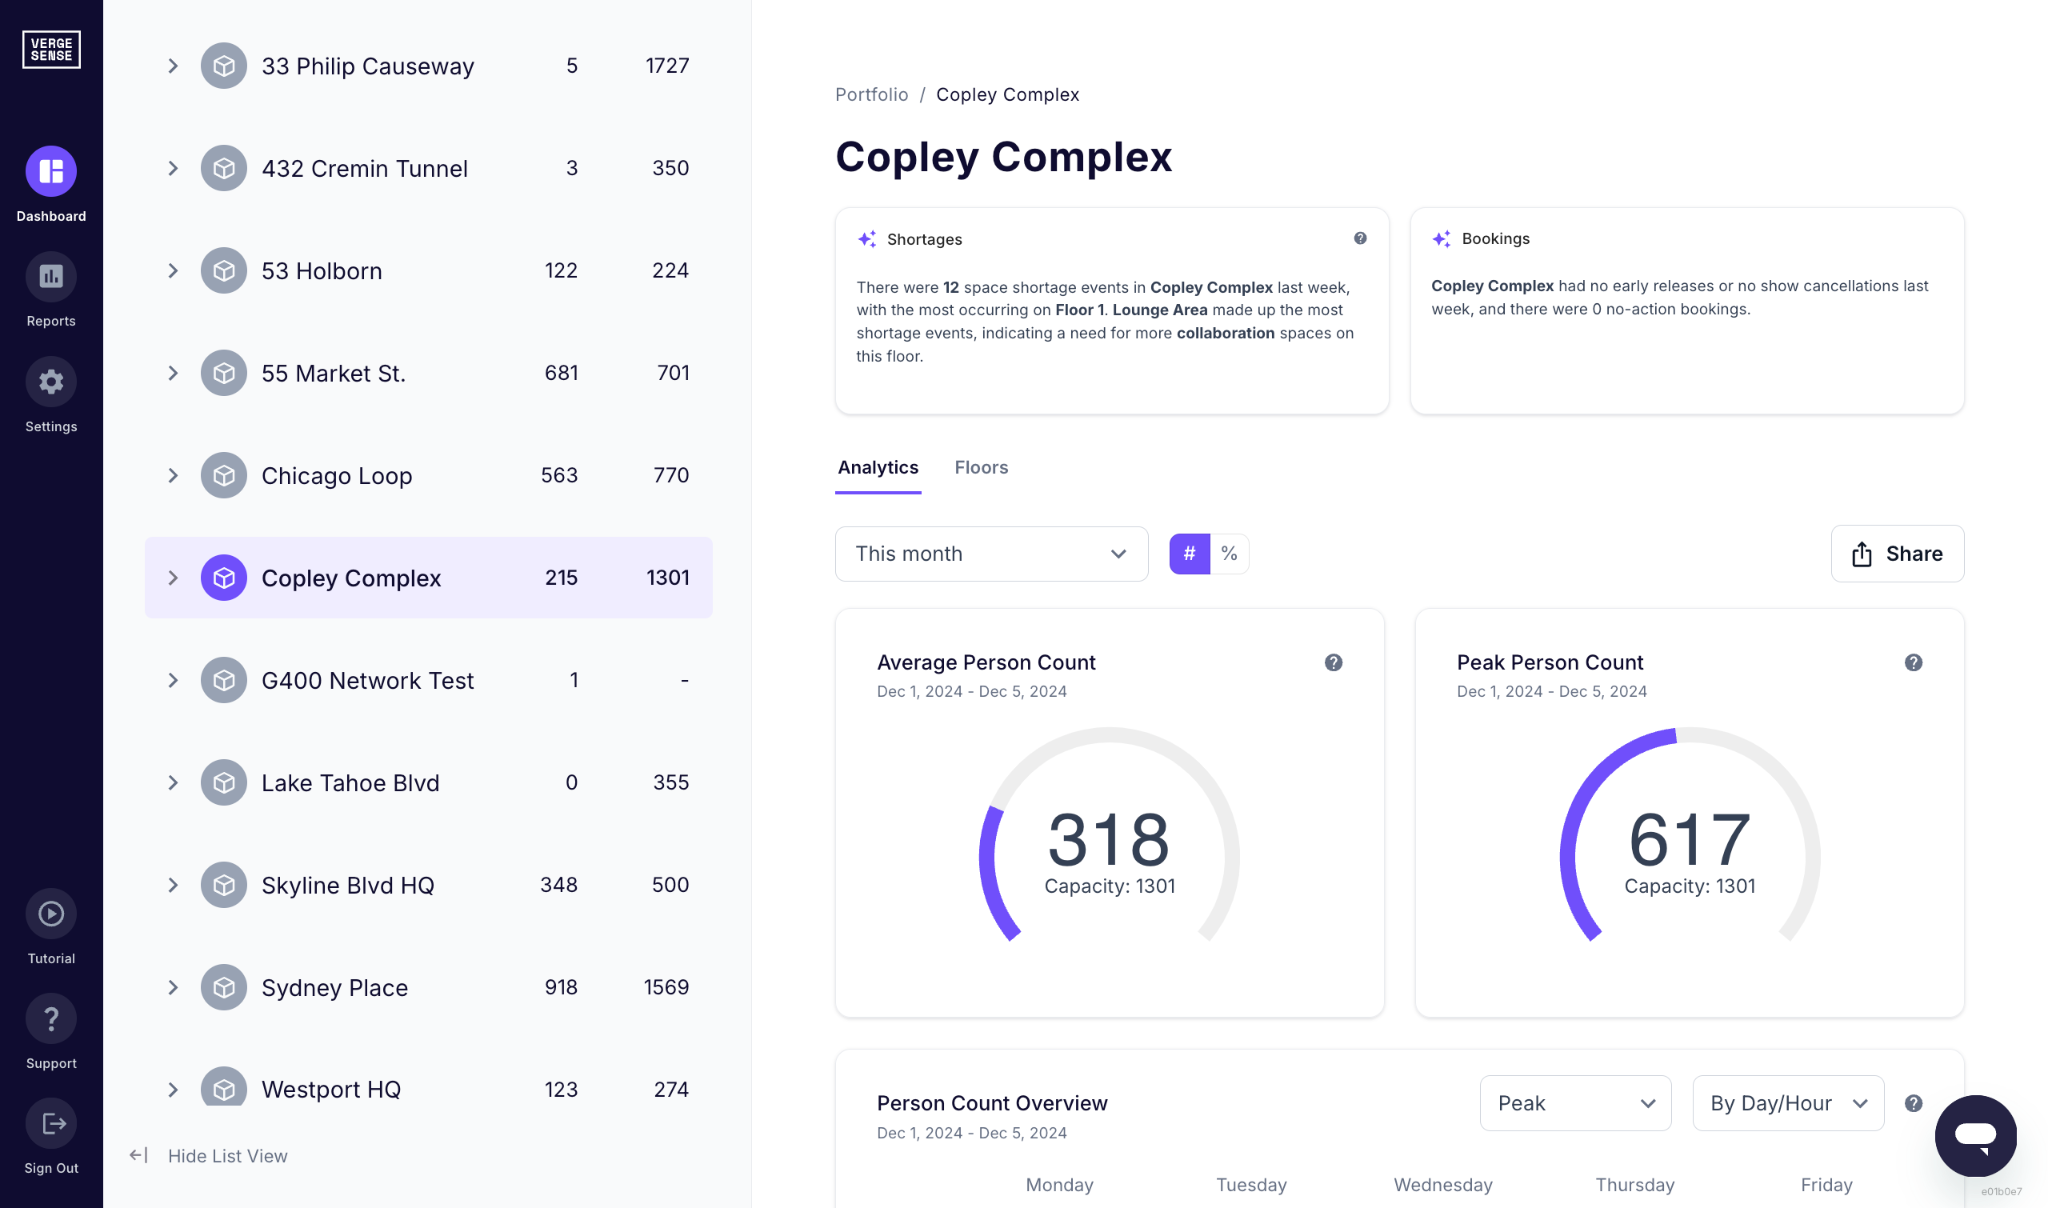
A dashboard that supports planning decisions needs more layers than a booking feed can produce. When you add portfolio comparison and trend forecasting on top of these metrics, you can rank locations, watch demand move week to week, and model what next year looks like.
The figures below come from the 10th Workplace Occupancy & Utilization Index.
Actual Versus Scheduled Occupancy
Scheduled occupancy comes from the room booking system, but only measurement can report actual occupancy. The difference between them tells you how much of your reported demand is accurate.
Teams find this out the hard way when a room that books out solid turns out to run half empty. Without a measured comparison, the booking record is the only version of events, and the plan you build from it repeats whatever the booking record got wrong. Bookings overstate demand when rooms are reserved and then have a no-show.
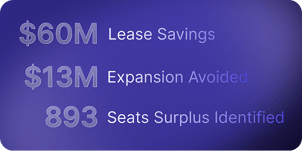
For example, a global consulting firm deployed VergeSense and found that 40% of its 10,400 monthly booking hours were ghosted, meaning 4,160 hours of rooms appeared held but were never used. The comparison stopped a plan to lease another floor at $600K a year, and 50 phone booths went in instead.
Evaluation tip: You should be able to see actual and scheduled occupancy in a single view, reported by space type, so you can tell which reservations converted into use.
Passive Occupancy
Passive occupancy is space held without anyone actively using it, as distinct from active occupancy, where a person is present and working. For example, someone leaves a jacket over the chair and a laptop open, then spends the next hour in a meeting two floors up. The desk is unavailable to everybody who walks past it.
Bookings understate demand here, because the seat was never reserved but was still unusable.
When a global biotechnology company deployed VergeSense, the workplace team found up to 50% of its apparently occupied space was held by belongings rather than people. Dedicated storage near building entrances freed those seats to support 30% more employees on the existing campus and avoided $13M in expansion costs.
Evaluation tip: When speaking with vendors, ask whether their dashboard reports active and passive occupancy separately, so a seat count reflects what people are holding as well as what they booked.
Space-Type Performance
Utilization varies more across space types than it does across floors. Rooms built for 12 or more people are in use more of the day than any other size, yet at their busiest a twelve-seat room holds only three or four people. The one-to-three person rooms run closer to full, with one or two people in them.
At every room size we measure, the average group is about two people, and a booking feed records the large room as taken, whether two people are in it or twelve.
Average occupancy across a portfolio hides these insights. But reporting by space type shows which categories are under pressure and which have room, which is the input a redesign or a neighborhood right-sizing decision actually needs.
Evaluation tip: Ask whether a platform reports results categorized by space type, and whether those categories match how your own floor plans are labeled. A dashboard that only reports at the floor level can't answer a question about collaboration rooms.
Peak Versus Average Utilization
Peak utilization is the highest level of demand a space reaches in a given period, and average utilization is that same demand spread across the whole day. A dashboard should report both, by space type and by hour, because you size capacity against the peak and cost against the average.
Average daily peak normalizes both figures. Take the highest point each day and average those across the measurement window, so one unusually busy afternoon doesn’t set your capacity target on its own. A floor sitting at half its seat capacity reads as comfortable on a monthly average. But at that level, it already carries a 58% chance of leaving somebody without a seat.
Evaluation tip: Make sure the dashboard reports by hour and by day of week. An average smoothed across quiet periods will show room that isn't there when demand peaks. Ask for average daily peak as well, so the number you plan against reflects a normal day rather than a single outlier.
How VergeSense Surfaces What Booking-Based Dashboards Can't
You need a dashboard that unifies the data you already have, including badge access data, room-booking systems, WiFi connections, and videoconferencing data. VergeSense combines all of these inputs with area sensors for more precise occupancy measurement.
The software can also ingest occupancy data from sensors already deployed by other vendors, including Density, XY Sense, and PointGrab, so a portfolio standardized on another device doesn't have to switch to get one unified view.
Occupancy Intelligence is the historical analytics layer inside Meridian, The Workplace AI Platform. The dataset behind the analytics covers 250M+ sq ft of measured workplace data across 210+ enterprise customers in 50+ countries, with 50+ native integrations into the systems that already hold your booking and badge records.
One example of that in practice: a global investment bank ran its cleaning program on a fixed schedule and its HVAC at full capacity, with no daily read on which spaces were in use. Connecting VergeSense occupancy data to its facility management platform gave both the facilities and cleaning teams a live view of space usage at the room level.
The bank cut its cleaning schedule by 50%, reported $2M in annual cleaning savings against a $4M baseline at a single major office, and saw up to 30% daily energy savings from matching HVAC schedules to measured occupancy.
From Measurement to Planning
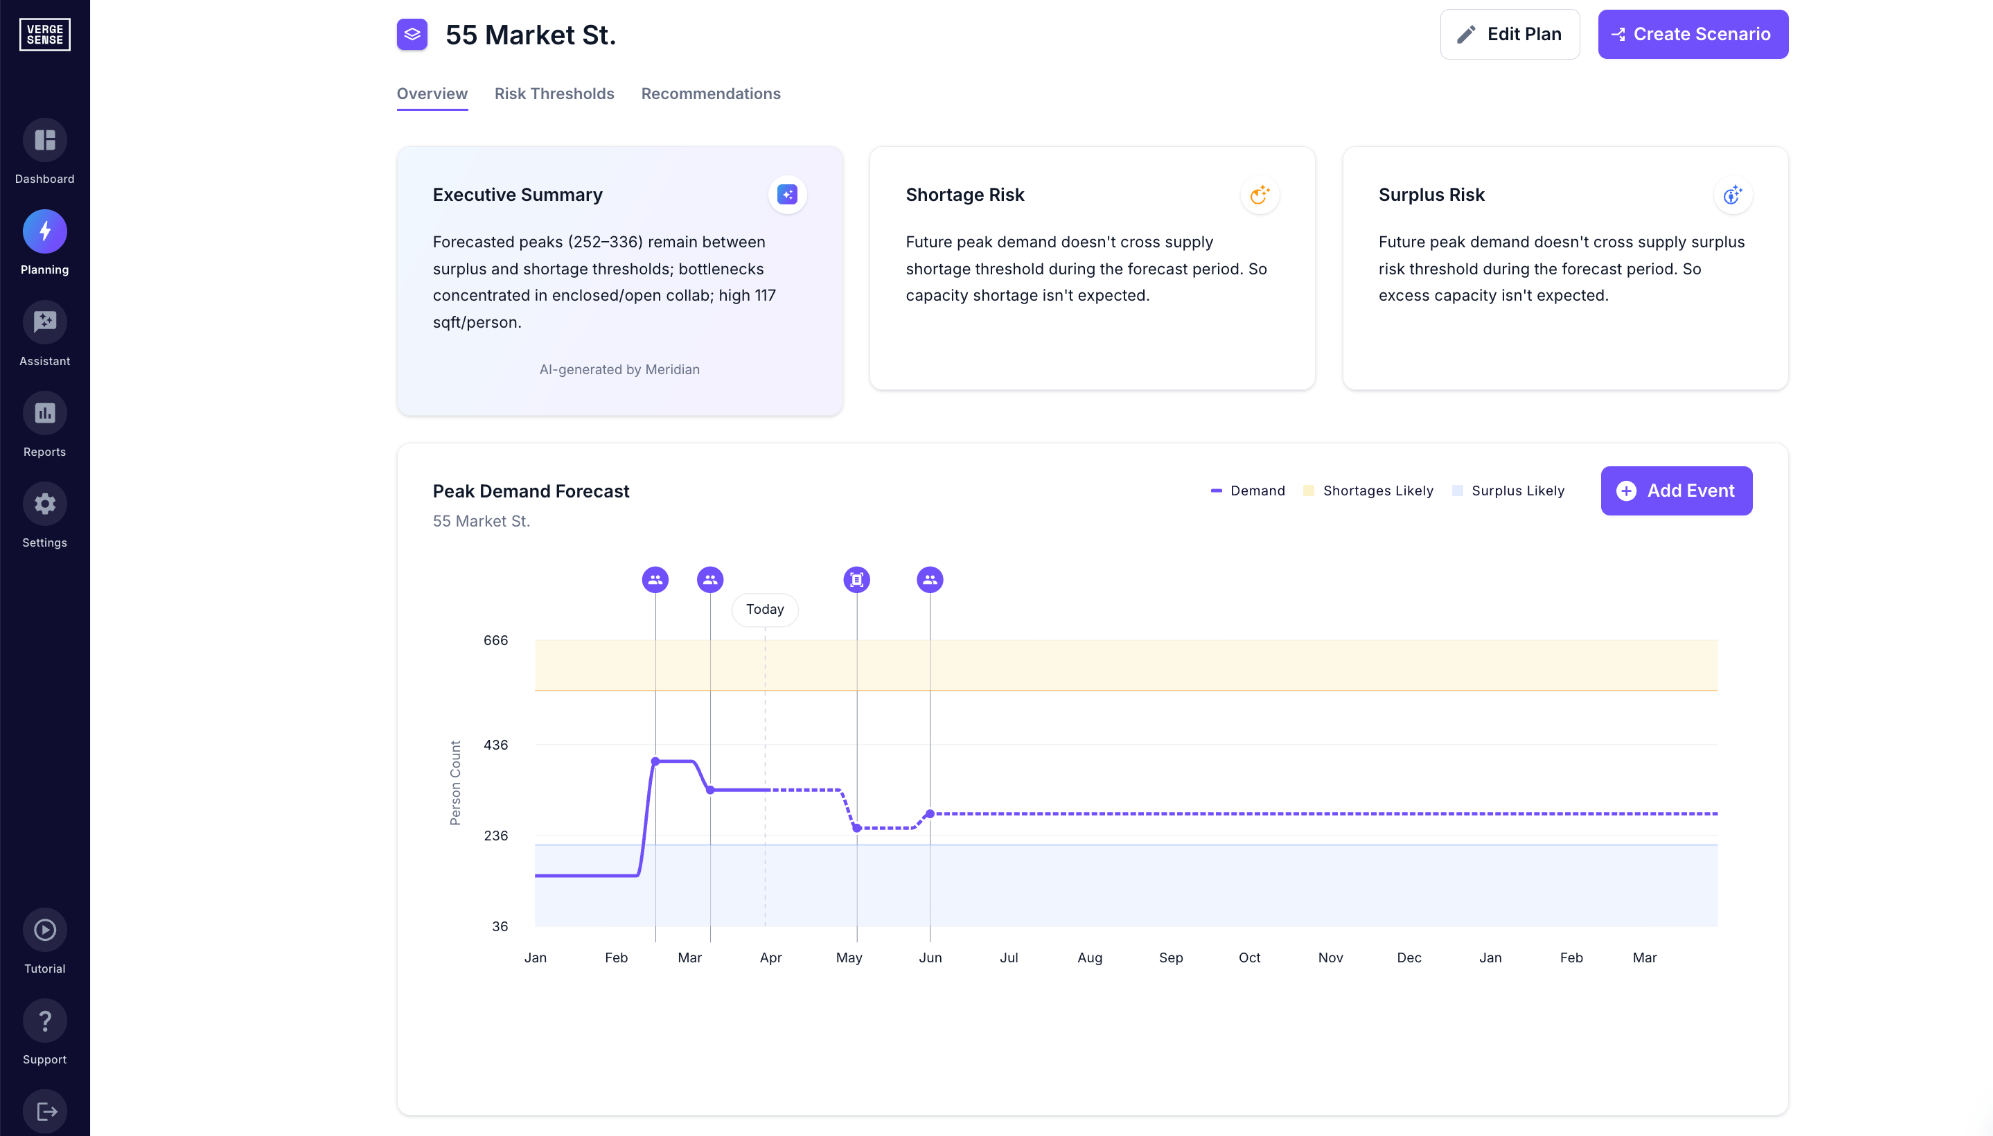
Predictive Planning turns measured usage into a plan. The same unified data feeds space planning work on right-sizing, design, occupancy planning, and operations decisions.
The platform models scenarios with your unique data, which enables you to forecast demand by location and work mode before committing to a lease or a floor plan. It compares options side by side and finds the office attendance level where a given space type runs out.
Curious how your own utilization data reads next to the wider field?
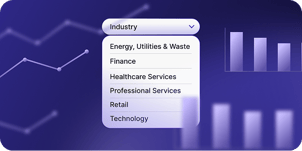
The VergeSense 10th Workplace Occupancy & Utilization Index holds measured benchmark data from 250M+ sq ft of workplace space, and the interactive explorer lets you filter it by industry, region, and day of week.
How to Evaluate an Office Utilization Dashboard
These five questions will help you evaluate between solutions.
- What data sources feed the dashboard? Look for badge access data, room-booking systems, WiFi connections, videoconferencing data, and occupancy sensors, plus support for third-party sensor data if you already have devices installed.
- Does it distinguish actual from scheduled occupancy? A platform holding only booking and calendar records can't produce that comparison.
- Can it report passive occupancy? Held space with no reservation attached is invisible to booking and badge feeds, and it changes seat-count conclusions.
- Does it report at the space-type level? Floor-level reporting can't answer a question about focus rooms or collaboration zones.
- Does it connect to planning workflows? Check whether measured data flows into scenario modeling or you’ll have to export a spreadsheet to get there.
Once you’ve put these five questions to a platform, you’ll know which one lets you walk into a planning conversation with recommendations the data backs up.
See how VergeSense holds up against all five evaluation questions.
We’ll walk you through how the dashboard reports utilization by space type, how actual use gets compared against booking records, and how measured data feeds scenario modeling.
FAQs About Office Utilization Dashboards
How Is Office Utilization Measured Without Occupancy Sensors?
Office utilization can be measured without occupancy sensors using badge access data, room-booking systems, WiFi connections, and videoconferencing data. These sources report at the building or floor level rather than the individual space, so they show which days people came in but not which spaces they used.
What Is the Difference Between Occupancy and Utilization?
Occupancy and utilization answer different questions about the same space. Occupancy counts whether a space is in use at a point in time. Utilization measures how much of a space's capacity gets used over a period, which is the figure an office utilization dashboard reports for planning decisions.
Can an Office Utilization Dashboard Integrate With Existing Workplace Tools?
An office utilization dashboard connects to existing workplace tools through pre-built API connectors for booking, badge, WiFi, and videoconferencing systems. VergeSense, for example, offers 50+ integrations, so measured usage reports alongside platforms like Eptura, Robin, and Microsoft Places.
How Often Should Utilization Data Refresh in a Dashboard?
Utilization data should refresh in a dashboard in real-time for operational decisions, with continuous measurement underneath so the trend view holds up. Real estate teams planning a lease or a redesign care more about months of consistent historical data than about a live count.