



When it's time to tell leadership whether a floor can come off next year's lease, you're probably looking at a badge export, a room-booking report, and a WiFi log IT pulled for you. But those files can’t answer the question on their own. That’s what an office space utilization analysis is for.
This exercise compares how much space people actually use against how much capacity you're paying for, so you can right-size your portfolio, redesign what you already hold, or change how teams are assigned workspace.
This piece explains:
- What a utilization analysis measures, and why badge and booking exports don't answer it on their own
- The five data sources that feed the analysis, and what each one leaves out
- How to set an internal baseline and read it against industry benchmark data
- How to turn findings into portfolio, design, or policy decisions
- The mistakes that most often undermine the result
See what a year of measured data looks like across the market.
The 10th Workplace Occupancy & Utilization Index reports where floors run short, which space types run out first, and how much margin the median floor has to plan in.
What Is Office Space Utilization Analysis?
An office space utilization analysis measures occupancy levels against the capacity available, then uses the difference to inform real estate and workplace strategy decisions. Capacity is what you lease, build, and furnish. Utilization is the share of it people actually use.
Badge and booking data are limited, and sometimes misleading. Badge swipes count who entered the building, and bookings record what people reserved. Neither tells you whether a boardroom held twelve people or two, or whether the quiet-focus rooms your design team added last year get used at all.
You're looking for a pattern that stands up over weeks, by space type and by day, which is why a structured office space utilization study runs over a window of at least 8 to 12 weeks instead of a single sample.
Without an analysis, CRE teams sign lease commitments against assumed headcount, and office design teams end up spending budget on space types that people don’t end up using and neglecting those that employees want more of.
The Five Data Sources That Power a Utilization Analysis
Utilization data comes from systems you probably already have access to. Below we look at what each one tells you, where it lacks, and how it can be supplemented with other sources alongside it.
- Badge access data counts who entered a building or a secured floor. It's reliable for office attendance and day-of-week patterns, but it says nothing about where people went once inside or how long they stayed.
- Room-booking systems show intent: what people reserved and for how long. Bookings often overstate real use, because held rooms sit empty and recurring invites outlive the project that created them.
- WiFi connections cover an entire real estate portfolio without the need for new hardware. But resolution stops at roughly floor level, and one person with a laptop, a phone, and a tablet reads as three.
- Videoconferencing data shows how many meetings ran hybrid and how many people joined from a room rather than a desk. It only covers spaces with this equipment installed.
- Occupancy sensors measure a specific area directly, down to whether a seat is held by someone's belongings rather than a person.
No single source answers a planning question on its own, so you want to pull from several and sort out the differences between them. For example, VergeSense Occupancy Intelligence unifies your data sources including badge, WiFi, room booking, and video conferencing, then fills in what those systems miss with forecasts based on 250M square feet of real-world data. .
It can also ingest data from third-party occupancy sensors, including Density, XY Sense, and PointGrab, so a portfolio with mixed hardware can still be analyzed as one dataset.
How AI Modeling Layers on Top
Once you have occupancy data across a portfolio, modeling lets you test a change before you commit. VergeSense does this with its Large Spatial Model, trained on 250M+ sq ft of measured workplace data, which estimates occupancy for locations you don’t measure directly and forecasts demand for the ones you do.
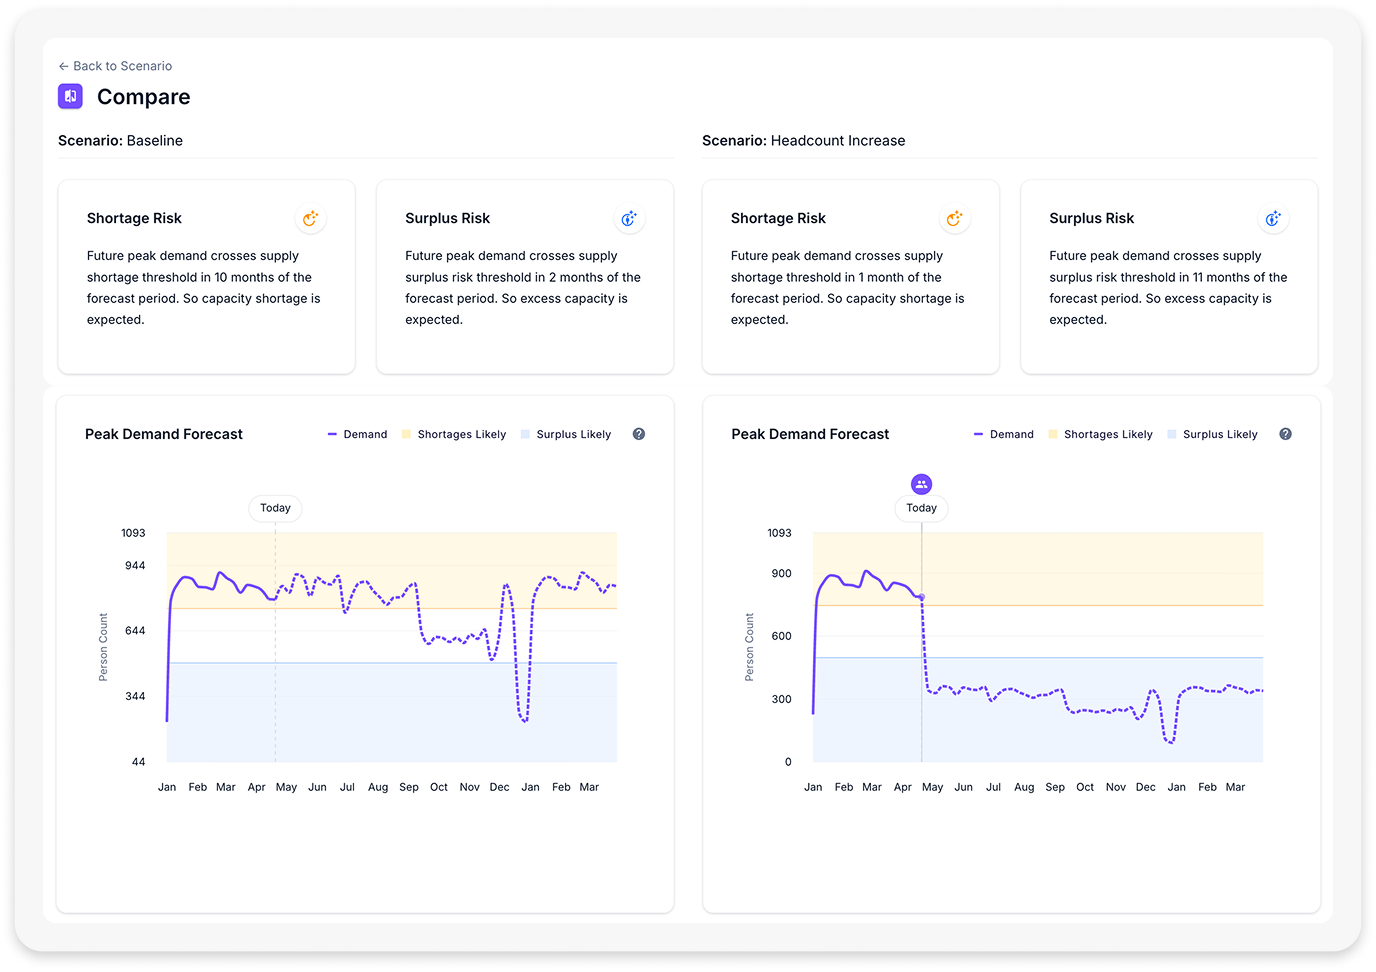
Predictive Planning sits on top of that and models scenarios with your unique data, whether that’s consolidating two sites or changing a floor's space mix. Each scenario returns a forecast you can compare side by side, including the point where a floor crosses into shortage or surplus.
What Good Office Space Utilization Looks Like
Many teams might not have a good handle on what an average week’s office space utilization looks like in their own portfolio, let alone what a comparable office in their industry sits at. Without a baseline, the same space utilization rate can sound either alarming or fine depending on who's presenting it. Here’s what to look at to measure where you stand.
Industry Benchmarks vs. Internal Baselines
An internal baseline is your own portfolio's normal, measured over a window long enough to account for vacation weeks, quarter-ends, and the midweek peak. This is the number every future change gets measured against.
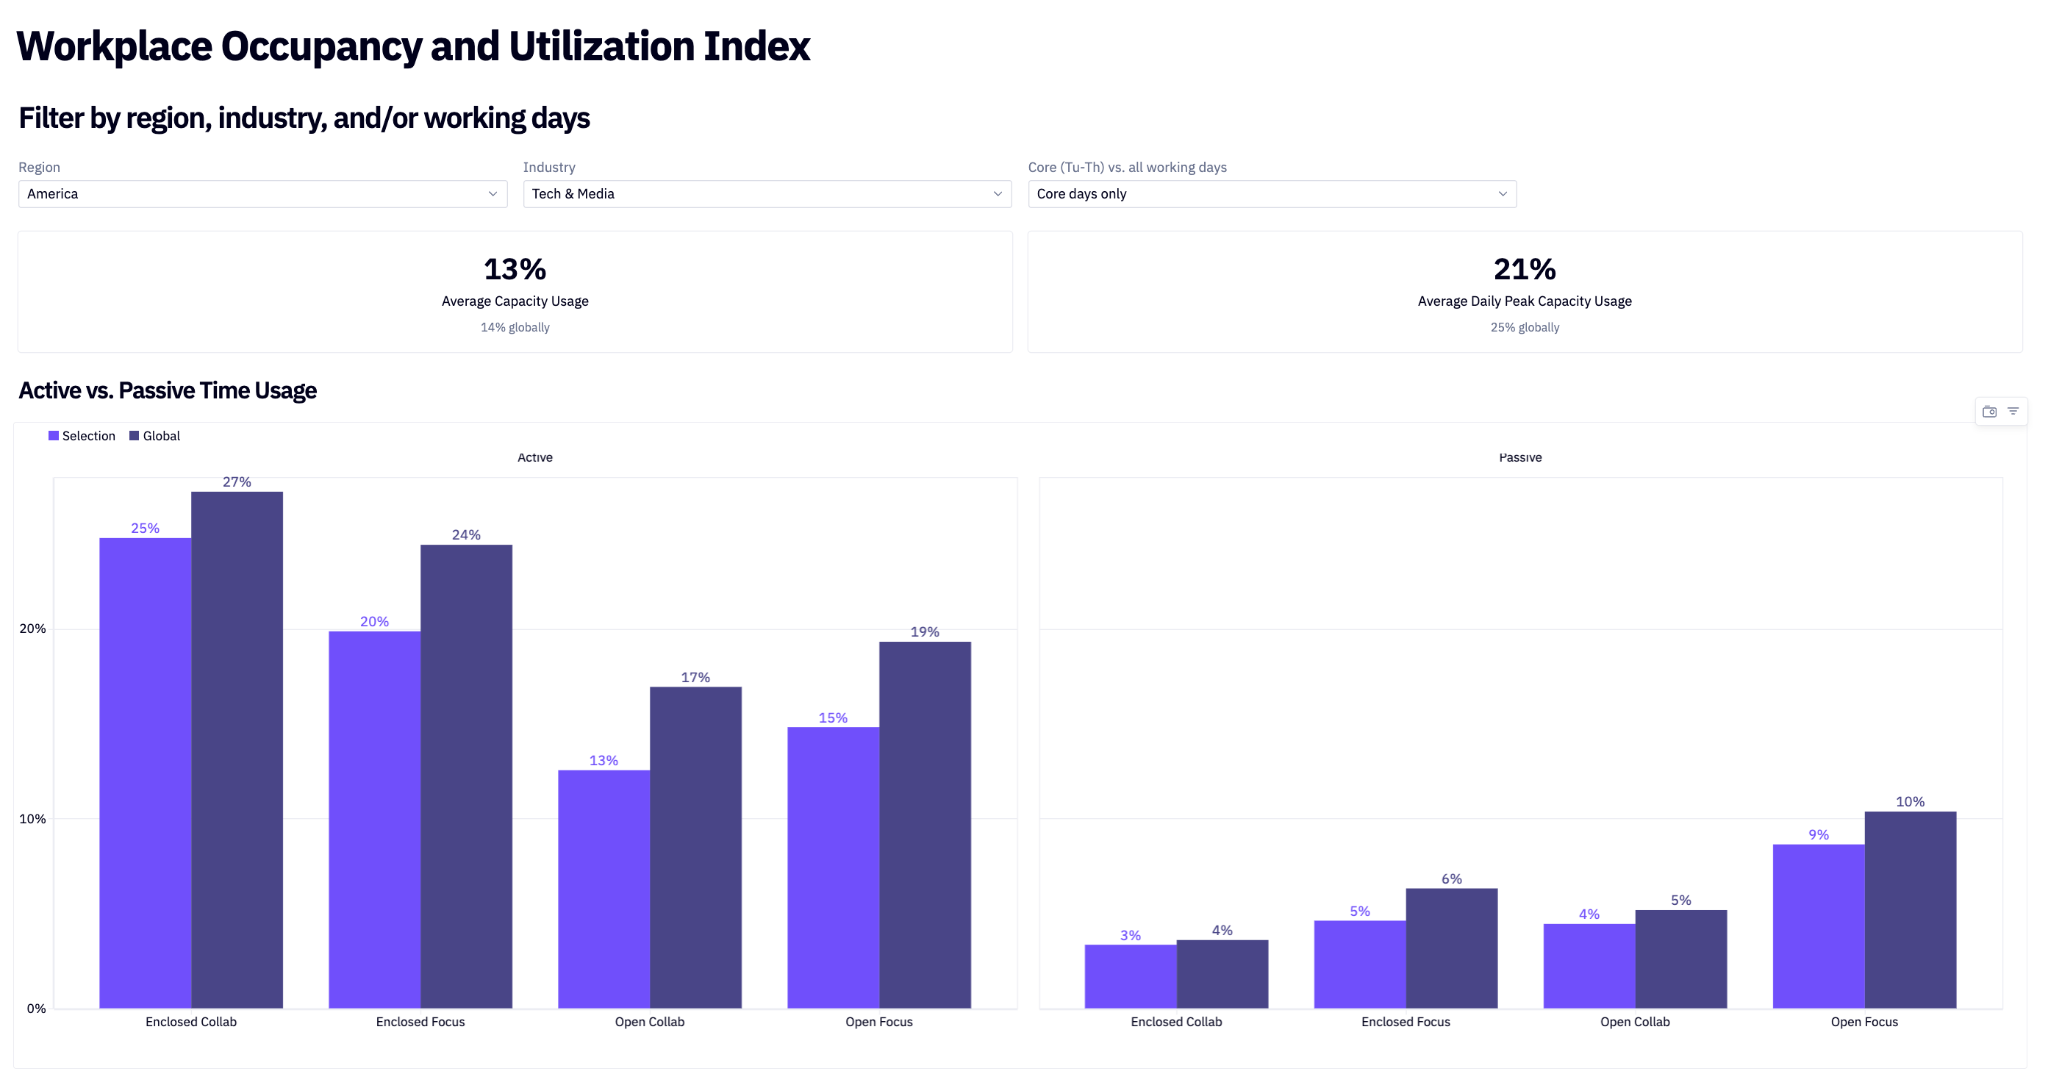
Then compare against benchmark data from outside your portfolio. The Workplace Occupancy & Utilization Index Explorer tracks measured utilization across 210+ enterprise customers, 50+ countries, and 1,400+ sites, so you can compare your office against others in your region and industry.
Peak vs. Average Utilization
Average utilization tells you how much space goes unused. Peak utilization points at shortage risk. Report both, by space type, by hour and day. A planning decision built on the average alone can undersize the spaces people use most.
Research shows that, at half capacity, a floor already has a 58% chance of leaving someone without a seat, and enclosed collaboration accounts for roughly 84% of the people left unseated. Complaints tend to start when around 70% of a floor's meeting rooms are in use, and this can happen even in a half-empty building.
Want a benchmark for your own numbers?
The 10th Workplace Occupancy & Utilization Index, measured across 250M+ sq ft, explains when shortage concentrates during the day to help you better plan for your workspace.
Interpreting the Results: From Data to Decisions
Every finding in a utilization analysis should inform your portfolio strategy, floor plan, or workplace policy. Here are the three ways you can transform the data into a decision.
To right-size the portfolio, start with the floors or sites running below baseline across the measurement window. Run scenarios for an exit, a consolidation into a nearby site, or an expansion, then compare forecast demand against the capacity each option leaves you. A floor that runs low on both average and peak should spark a lease conversation, while a floor that peaks hard on a low average usually needs a space-mix fix instead.
To redesign existing space, start with the space mix. The average group at every room size is about two people, and rooms built for 12 or more never run more than a third full even in their busiest month. A room built for twelve holds one meeting whether two people are in it or twelve, so splitting it into three smaller rooms gives you three concurrent meetings without adding a square foot.
To adjust workplace policy, start with timing. Midweek concentration creates shortage on Tuesday and surplus on Friday, and no amount of square footage fixes a distribution problem. Anchor days, team-level attendance targets, and staggered schedules all cost less than a floor addition.
Common Mistakes That Undermine a Utilization Analysis
A handful of issues come up repeatedly in utilization work, and each one has a simple correction.
- One data source doing all the work. Badge data describes attendance and booking data describes intent, but neither gives the full picture by itself. Pull at least two sources that measure different things, then compare them.
- Treating bookings as occupancy. The distance between a reserved room and an occupied room is often the most useful finding in the whole analysis, so be sure to measure and compare both.
- A one-week snapshot. A single week can capture a holiday, an offsite, or a quarter-end crunch. Run a continuous window of at least 8 to 12 weeks before drawing a conclusion.
- Averages with no peak attached. A mean hides the midweek crunch that drives employee complaints. So compare every figure by day and hour, by space type.
- Analysis as a one-time project. A utilization figure from last year can't support this year's lease decision. Set a measurement cadence so the baseline is current whenever a lease event comes up.
Your First Utilization Analysis, in Four Steps
The first version of this analysis runs on systems you already have. Here are four steps to get it moving:
- Audit your current data sources. Record which badge, booking, WiFi, and video conferencing systems you can actually pull from, and who controls access to each.
- Write down the decisions the analysis has to support, with the dates they're due. A lease renewal in 14 months sets a different measurement window than a design kickoff next quarter.
- Set a measurement cadence. Decide how often to refresh the baseline and who reviews it, so the number is current come time to make a decision.
- Choose a platform that carries measurement through to the decision. Office space utilization software varies widely in whether it stops at dashboards or goes on to scenario planning.
Meridian, The Workplace AI Platform, ties those steps together. It unifies the data you already have, including badge, WiFi, room booking, video conferencing, and third-party sensors, with its own measurement where gaps remain. It then compares what it finds against 250M+ square feet of real workplace behavior and models scenarios with your unique data.
Done properly, this analysis ends with a number that supports your decision and tells you the amount of space you actually need, with the evidence for why.
See how your portfolio compares to 250M+ sq ft of measured workplace data
The 10th Occupancy Workplace Occupancy & Utilization Index brings together occupancy and utilization benchmarks from 210+ enterprise customers across 50+ countries.
FAQs About Office Space Utilization Analysis
How Often Should You Run a Space Utilization Analysis?
An office space utilization analysis works best as continuous measurement with a formal review each quarter, rather than as a standalone project. Continuous data keeps the baseline current for lease events and design reviews. Teams facing a lease break or a renovation should review monthly in the run-up to the decision.
What Utilization Rate Is Considered Good for an Office?
A good office utilization rate is a range rather than a single number, which is why an office space utilization analysis reports average and peak separately. The 10th Workplace Occupancy & Utilization Index puts the median floor's functional zone between 31% and 42% of seat capacity, with shortage starting around 42.5%.
Can You Run a Utilization Analysis Without Occupancy Sensors?
You can run an office space utilization analysis without occupancy sensors, using the badge access data, room-booking systems, WiFi connections, and videoconferencing data you already collect. However, those sources resolve to floor and building level, so space-type questions stay fuzzy. Sensors add a more accurate read where necessary.
What Team Should Own the Utilization Analysis Process?
Corporate real estate typically owns the office space utilization analysis, because the output feeds lease and capital decisions. Workplace experience and facilities teams supply operational context and data access, and IT provides the WiFi and videoconferencing feeds.
Teams should agree on the measurement standard, establishing what counts as a meeting room, how each site's capacity is set, and which hours count. Without that, two sites can report the same number and mean different things.