- Space Availability
- Neighborhood Planning
- Portfolio Evaluation
- Dynamic Operations
- Intelligent Space Design
- Product

You are deciding on a lease renewal, a consolidation, or a neighborhood redesign, and the data on your desk is a badge-swipe report and a stakeholder's gut feel.
Neither one tells you whether the floor you are about to give up is actually empty on Tuesdays, or whether the collaboration zone you are about to expand is already running at 85% capacity.
Occupancy sensors are how you can replace that guesswork with a measured signal. They turn the question "is this space being used?" into a numerical answer with a time series behind it.
But the category has fragmented: multiple sensor types in active enterprise deployment, accuracy claims that range from 85% to 99%, and vendor pitches that all sound interchangeable. Pick the wrong category and you end up with a feed that doesn't answer the question on your desk: a science project, not a tool.
This guide is for CRE and Workplace Experience leaders evaluating different types of sensor technologies. You’ll find:
- What an occupancy sensor is (and how it differs from a presence detector)
- What occupancy data shows about workplaces in 2026 that headcount projections miss
- Occupancy sensor types commonly deployed in enterprise offices, and what each one measures
- The buyer criteria you should apply when evaluating vendors
- Where occupancy sensors fit inside a portfolio-wide occupancy intelligence stack
Comparing sensor categories for your portfolio?
See how VergeSense combines Predictive Planning, WiFi-based signal, and Infinity Area Sensors into one platform.
Book a Demo →
What Is an Occupancy Sensor?
An occupancy sensor is a device that detects whether a defined space, such as a desk, a room, a floor zone, or a building, is in use, and the trends of that use over time.
The category splits into two functional tiers worth distinguishing:
- Presence detection. Binary on/off, motion-triggered. Someone or something is moving, or the sensor reads empty. Useful for triggering a light or unlocking a door. Not useful for planning a 200,000-square-foot floor, where a stepped-away desk reads the same as an unused one.
- Occupancy intelligence. Continuous measurement that captures counts, active occupancy, and passive occupancy. Passive occupancy is the difference between an empty chair and a chair whose owner stepped out for a fifteen-minute meeting.
Sensors that only do the first tier produce operational data, enough to run a light, not enough to plan a floor. Sensors that do the second produce decision-grade data. The distinction matters as soon as the question is "should we keep this floor?" instead of "is the light on?"
What Occupancy Sensors Measure
The 9th edition of the Occupancy Intelligence Index reports a pattern that has held all year: average capacity sits between 9% and 11%, while peak capacity runs between 52% and 60%. Same population, much tighter midweek windows.
That gap is the central planning problem of today. Average utilization tells you the building is empty. Peak utilization tells you it is overflowing on Tuesday at 2 PM. If you plan around either number alone, you make the wrong decision.
Space type, not square footage, is where the answer lives
The Index sorts measured activity into four normalized space types (Enclosed Focus, Open Focus, Enclosed Collaboration, and Open Collaboration), so like spaces can be compared on the same terms across the dataset. That apples-to-apples view is what surfaces the real problem: a specific type of space running short, which a building-wide square-footage number hides.
The current data shows an 18% Enclosed Collaboration shortage at 2 PM across measured portfolios. Badge data and headcount projections do not surface this. A sensor stack that can segment by space type does, and it tells you to add bookable rooms, not square feet.
Average and peak need different responses
Designing for the average produces empty buildings that feel underused. Designing for the peak produces wasted square footage that finance will eventually catch. The point of measurement is to hold both views at once and make different decisions about different space types.
What CRE and Workplace Teams Use Occupancy Sensor Data For
Three use cases drive almost every enterprise occupancy sensor deployment: portfolio decisions, space design, and building operations.
Right-sizing the real estate portfolio
Continuous utilization data is what makes defensible right-sizing possible — for lease renewals, consolidations, and disposals. A few concrete examples from VergeSense customers:
- Fresenius Medical Care: $60M in lease cost avoidance over 10 years, driven by continuous utilization data feeding portfolio decisions.
- An Australian financial services firm: $18M saved over three years.
- A global biotech: $13M in expansion costs avoided.
The pattern is the same in each case. These teams were making major portfolio calls without the data to back them. Continuous measurement gave them the confidence to act, and the numbers held up when finance and leadership pressure-tested them.
The reason these decisions hold up in front of a CFO is that the measurement is continuous, not a one-week study.
This is where Predictive Planning, the decision support layer for real estate and workplace teams, built on the Large Spatial Model (LSM), does the work that a dashboard cannot. The LSM is trained on 250M+ sq ft of measured workplace data, so the scenarios it runs are grounded in actual portfolio behavior, not a vendor-built assumption set.
Planners start closer to the finish line: scenarios already modeled, rerunnable in hours when conditions change, and defensible in front of leadership with quantified trade-offs.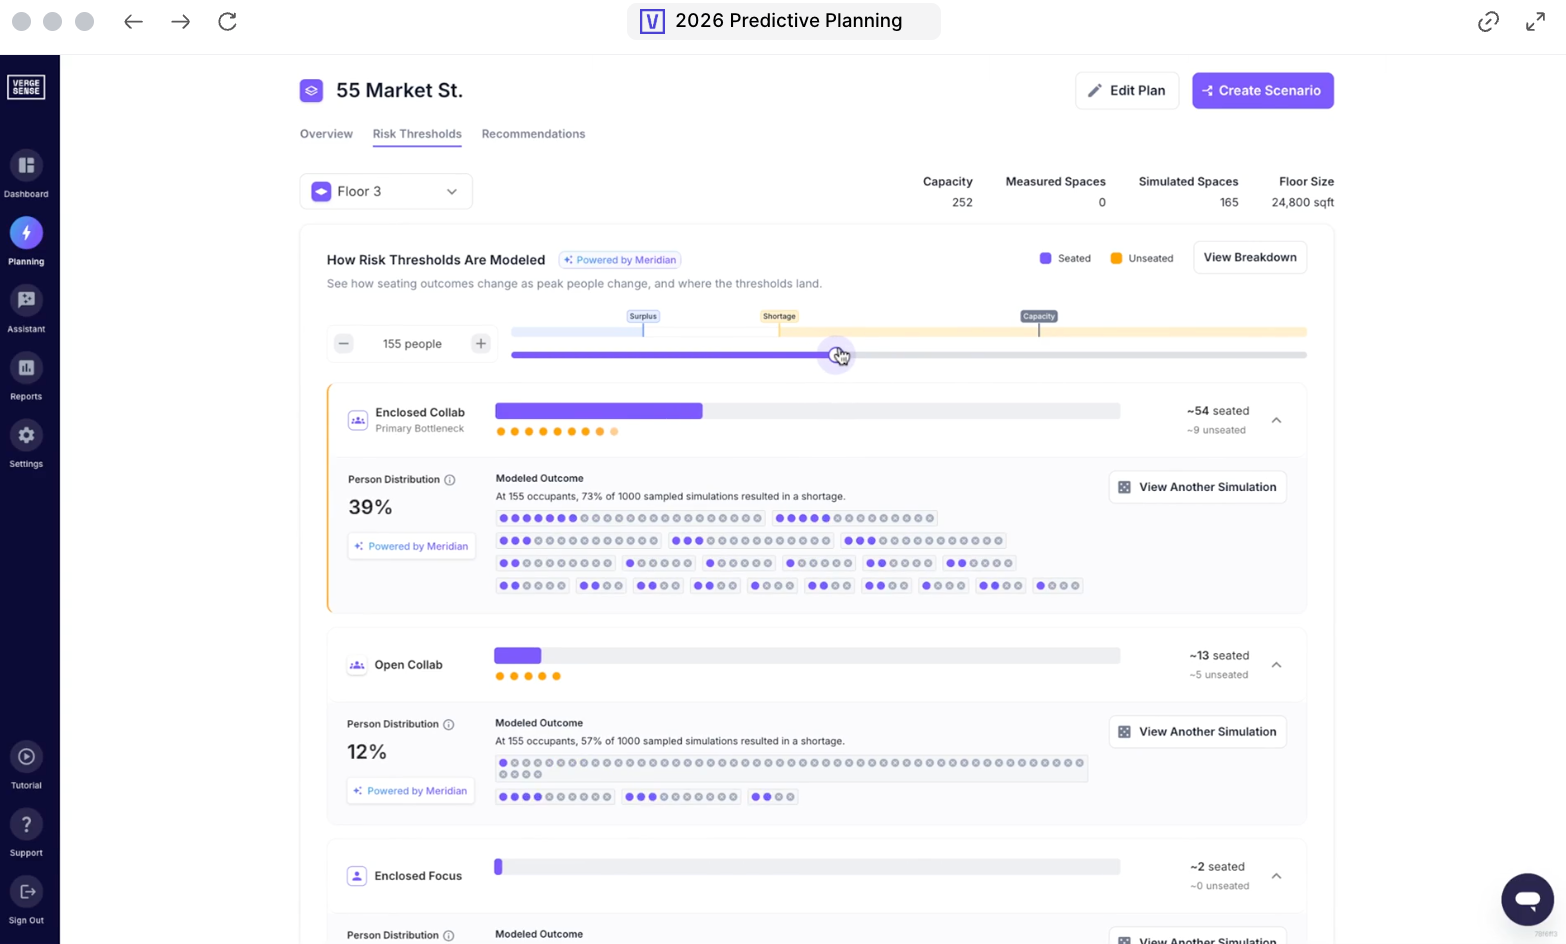
Designing spaces that match how teams actually work
The same Index data shows a structural space-mix mismatch. Enclosed Focus represents only 8% of measured footprint, but runs at 77% average occupied capacity. Open Focus is carrying 85% as overflow — not as design.
That is a mix problem, not a quantity problem, so, while adding more square footage won’t fix it, reallocating space types will. CHG Healthcare saw this firsthand: the team had built its sales floor around open, flexible collaboration areas, then used occupancy data to test whether the design matched how people actually worked. It did not.
Workstations carried the traffic while the open collaboration zones sat underused, because the sales teams preferred to collaborate at their own desks. They right-sized the collaboration space, reinforced the workstations, and utilization climbed without adding a square foot of floor.
Aligning building systems to actual demand
Building operations teams care about ESG and operating cost in equal measure. Occupancy data feeding Analytics — and downstream into ServiceNow Workplace Service Delivery or a BMS — means cleaning, climate, and energy follow demand instead of a 9-to-5 schedule that no longer reflects how anyone uses the building.
The savings can be substantial. One global bank integrated occupancy data into its building operations platform and cleaned only the spaces that were used each day, cutting about $2M a year in cleaning costs. The operational change is bigger than the line item, though: a janitorial route that triggers on actual use instead of a fixed schedule frees labor for the spaces that need it.
The Six Types of Occupancy Sensors Used in Enterprise Workplaces Today
Six sensor categories are in active enterprise deployment in 2026. They differ in what they measure, how accurately, and at what granularity.
1. Computer-vision enabled area sensors
Ceiling-mounted area sensors that use on-device computer vision to count people, distinguish active from passive occupancy, and segment results by space type. Processing happens on the device — no PII leaves the sensor, no images are sent to the cloud.
The Infinity Area Sensor is the category example, with a ten year battery life that renders it maintenanc-free and the only passive-occupancy area sensor on the market. Passive occupancy is space that is still claimed by a person's belongings when no one is physically in it: a laptop and notebook left on a conference table while the group steps out for coffee, a bag on a chair, a jacket over a desk.
A presence-only sensor reads that room as empty, marks it available, and lets the booking system reassign it, so the group comes back to a collision. A passive-occupancy sensor sees the belongings, holds the room as occupied, and prevents the double-booking.
Accuracy sits at roughly 95% at the area level, compared with roughly 85% for WiFi-derived counts. This is the category to reach for when the decision being made is room-level or neighborhood-level — collaboration spaces, conference rooms, or neighborhood pods of desks.
2. PIR occupancy sensors
Passive infrared (PIR) sensors mount on a ceiling and detect body heat and motion across a room's footprint. They are cheap and quick to install, which is most of the appeal.
Accuracy is the trade-off. PIR keys on movement, so someone sitting still reads as an empty room, and the signal gets noisy near a vent or in direct sunlight. That makes it a reasonable presence and motion signal at the room level, but not a people-counting instrument, and not the tool for fine-grained conference room analysis.
3. PIR desk sensors
Under-desk PIR units that detect whether a single desk is occupied by reading body heat and motion. Real-time, low-cost, easy to install at scale.
The employee-experience friction can be an issue. Research has surfaced that some employees feel anxious with sensors under their desks, and the most common cause is a communication gap rather than the sensor itself. Therefore, at the time of deployment, it’s important to be specific with employees about what the sensors capture and what they don’t.
4. Lighting-integrated sensors
Lighting controls that detect motion and switch lights accordingly. Energy savings are meaningful, particularly in conference rooms and executive offices.
These sensors are useful for cost and energy optimization. They rarely produce decision-grade utilization data on their own — they were designed for lighting control, and using them as a planning input means accepting their limits.
5. Door-counting sensors
Entry/exit counters mounted at a doorway. They work well in spaces with a single, bounded entry point — auditoria, training rooms, secured floors — and break down anywhere the path of travel is ambiguous or the space has multiple openings.
Modern units track entry and exit independently for net-in-room counts. They are still the wrong instrument for an open-plan floor.
6. WiFi and network-based occupancy data
WiFi infrastructure — Cisco Meraki, Juniper Mist, similar enterprise platforms — produces floor- and neighborhood-level occupancy signal as a byproduct of network operation. No new hardware required.
The trade-off is that WiFi counts devices, not people, at roughly 85% accuracy at the floor level. Two-device users, visitors, and devices left at a desk all distort the count. WiFi is the right tool for portfolio-wide floor and neighborhood counts where individual-space precision is not the question. It is the wrong tool for room-level decisions about adjusting design or space mix.
How to Evaluate Occupancy Sensors for Your Portfolio
The questions below are the ones that separate a vendor that will scale across a portfolio from one that will not.
- Accuracy SLA. What percentage does the vendor commit to in writing, and at what granularity — desk, room, floor, or building? Treat anything without a stated SLA as marketing.
- Passive occupancy detection. Can the sensor distinguish between an empty space and an occupied space whose user briefly stepped away? The Infinity Area Sensor is the only passive-occupancy area sensor on the market, and the absence of this capability shows up as phantom availability inside the booking system.
- Space-type segmentation. Can the data segment Enclosed Focus, Open Focus, Enclosed Collaboration, and Open Collaboration? Without segmentation, you cannot diagnose mix problems.
- Deployment model. Battery-powered or wired? Cabling requirements? Time to deploy across a multi-site portfolio? Deployment cost compounds quickly across 50+ sites.
- Integration footprint. Native integrations with BMS, IWMS, desk booking, ServiceNow Workplace Service Delivery, Microsoft Places — or middleware? Middleware adds latency, cost, and ownership ambiguity.
- Privacy posture. On-device processing or cloud-side video? PII handling? GDPR compliance for EU sites? Get this answered before procurement, not after.
- Methodology consistency. If you are combining sensor data and WiFi data across sites, do the metrics reconcile? Two vendors using different definitions of "occupancy" will produce two incompatible portfolio views.
- Decision layer. Does the platform end at a dashboard, or does the same data feed a scenario-modeling engine? A dashboard answers "what is happening." Scenario modeling answers "what should we do about it."
Common Pitfalls When Deploying Occupancy Sensors
- Treating sensors as the deliverable instead of the input. Sensors produce data. Decisions produce ROI. A deployment without a decision workflow attached is a hardware project, not a portfolio strategy.
- Deploying without a measurement methodology. Decide up front how the numbers get defined and reported: peak versus average utilization, occupied versus true capacity, and how active and passive occupancy are counted. A vendor without a clear answer here leaves you comparing inconsistent numbers across sites.
- Underestimating change management. Particularly under-desk PIR. The friction isn't the technology; it's the communication.
- Mismatched coverage strategy. Trying to cover every square foot with the same instrument. Deploying sensors everywhere is expensive and wasteful; no coverage at all in collaboration spaces becomes a planning blind spot. The right answer is a tiered stack: hardware sensors in high-value spaces, broader-coverage signal everywhere else.
- Relying on a one-time or stale read. Demand is uneven across the week and it keeps moving: the Index currently shows a Tuesday and Wednesday shortage of 13% and 12% against just 4% on Friday. A point-in-time study or a pandemic-era assumption set bakes in a pattern that has already shifted. A continuous, live data feed is what keeps the read current for decisions that have to hold up over time.
Where Occupancy Sensors Fit in a Portfolio-wide Intelligence Stack
The most useful reframe a CRE leader can make in 2026: the vendor decision is not about which sensor to buy. It is about which platform turns occupancy data into a portfolio decision.
VergeSense is a decision-making platform, not a sensor vendor. The platform matches three coverage layers to the value of the space being measured — hardware where the decision is highest-value, broader signal everywhere else:
- Full floors and unmeasured spaces — Predictive Planning. Predictive Planning forecasts how space will be used and models portfolio scenarios, so open areas and the spaces you have not instrumented still get coverage without putting hardware everywhere.
It runs on the Large Spatial Model (LSM), VergeSense's AI model trained on 250M+ sq ft of real measured workplace behavior. Because the model learns from how space is actually used, the scenarios it produces reflect real portfolio behavior, not a vendor's assumption set. You start from a floor plan alone, no sensors required, and model lease exits, headcount shifts, or RTO changes in hours instead of months. - Open areas — WiFi-based occupancy data. Floor- and neighborhood-level signal at portfolio scale. Broad coverage at lower granularity, leveraging the network infrastructure that is already in place.
- Conference rooms and desk spaces — Infinity Area Sensors. Hardware-level, decision-grade granularity reserved for the highest-value spots — conference rooms, collaboration spaces, neighborhood anchors. The places where passive occupancy detection and space-type segmentation actually change the answer.
All three feed VergeSense’s workplace AI platform. Occupancy Intelligence measures how space is used today, unifying sensor, WiFi, badge, and booking signals into one source of truth. Predictive Planning goes further, turning that measurement into demand forecasts, side-by-side scenario models, and ROI-backed plans.
The current scale: 250M+ sq ft of measured workplace data, 210+ enterprises, 50 countries, and 1,400+ sites deployed. That is the dataset the LSM is trained on, and the reason scenario modeling on the platform reflects portfolio behavior at enterprise scale.
Need clearer visibility into how your portfolio is actually used?
See how VergeSense helps CRE and workplace leaders turn occupancy data into right-sizing, neighborhood, and lease decisions.
FAQs About Occupancy Sensors
What's the difference between an occupancy sensor and a presence sensor?
A presence sensor reports binary on/off: someone is there, or no one is. That is enough to trigger a light. An occupancy sensor measures how many people are present, how utilization changes over time, and, with computer-vision sensors, passive occupancy. The difference matters as soon as the decision is "should we keep this floor?" rather than "should this light be on?
How accurate are occupancy sensors?
Accuracy varies by category. Computer-vision area sensors run at roughly 95% accuracy at the area level. WiFi-derived counts sit around 85% at the floor level. PIR sensors are reliable for detecting motion but much less precise as an occupancy measure: a stationary person can read as an empty room, which is why PIR is best treated as a presence signal rather than a people-counting instrument.
Are occupancy sensors a privacy concern?
The privacy posture depends on the sensor. Computer-vision sensors with on-device processing — such as the Infinity Area Sensor — produce counts without sending images off the device, capturing no PII. Cloud-video systems carry materially different privacy exposure. Confirm GDPR compliance, on-device versus cloud processing, and PII handling before procurement.
Do I need occupancy sensors in every space?
No. A tiered coverage stack is more cost-effective. Predictive Planning models unmeasured spaces, WiFi covers floor- and neighborhood-level counts, and Infinity Area Sensors handle the high-value spaces where decision-grade granularity actually changes the answer. Putting hardware everywhere is wasteful; putting it nowhere is a measurement blind spot.
How long does it take to deploy occupancy sensors across a multi-site portfolio?
It depends on the deployment model. Battery-powered units install in hours per site; wired hardware takes longer due to cabling requirements. Across a multi-site portfolio, ask vendors for a per-site deployment timeline and a method for sequencing rollouts so high-value sites are measured first. Bring change management into the plan — under-desk PIR, in particular, needs employee communication built into the schedule.