
Your leadership team wants a space plan. But the gap between "figure out what we need" and actually having a defensible plan ready to execute is where most real estate and workplace teams lose time. This month's VergeSense product updates are designed to bridge the gap between knowing and doing.
We focused on two things:
- Predictive Planning: user interface (UI) updates now power a streamlined experience built to get you from data to decision faster.
- Occupancy Intelligence: how to connect your data to the integrations and automations that turn insight into action and enable better efficiency across your workplace.
Predictive Planning: UI Streamlined for Faster Decision-Making
Speed to decision matters. The faster you can move from understanding how your space will perform under real demand to knowing exactly what to change and where, the faster your team can act. In March, we reorganized the Predictive Planning experience to reflect how planning conversations actually unfold, allowing you to spend less time navigating and more time making decisions.
Want a closer look? Click through the interactive demo above to see the redesigned Predictive Planning experience in action. Use the arrows at the top of the player to walk through each screen.
A Redesigned Experience:
Predictive Planning now follows a clearer three-step flow:
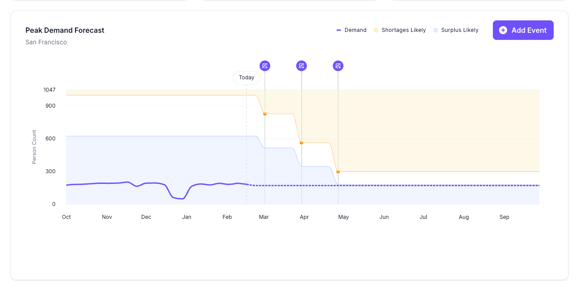
- Overview is your starting point and the primary output. Here, you can see whether this building is set up to support how people actually use it. Your forecast, key risks and trends, and where things stand today, all in one place.
- Risk Thresholds zooms into a single floor to show you the math behind your supply risk. Use the attendance slider to simulate any peak level in real time and watch the impact across each of the four normalized space categories.
- Recommendations turn all of the information contained in the Overview & Risk Thresholds pages into action. A summary at the top provides a high-level view of what changes support higher demand.
Instead of jumping between views to build a narrative, the platform walks you through one: here's what's happening, here's where the risk is, and here's what to do about it.
Model Two New Scenarios: Expansion and Consolidation
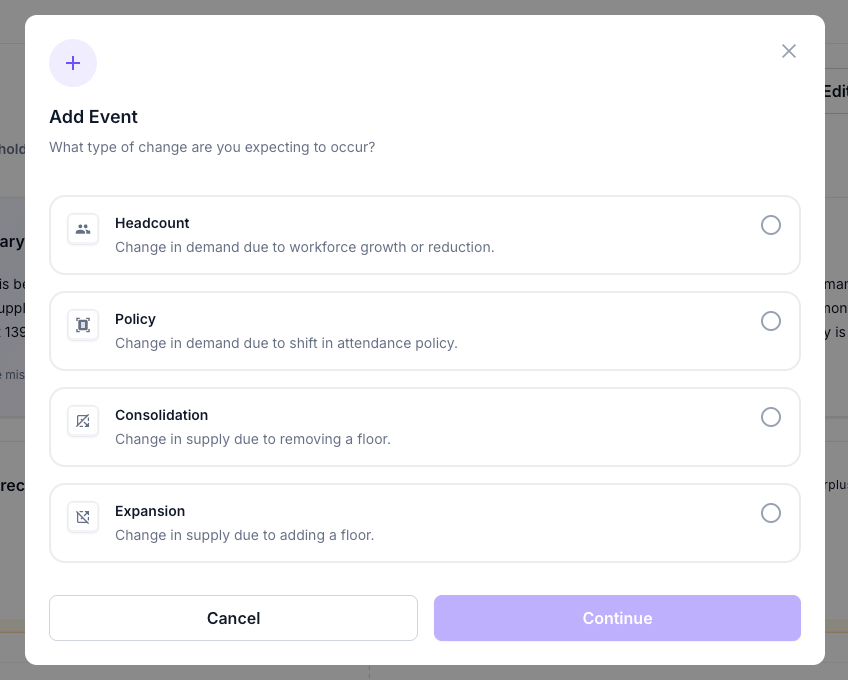
Planning doesn't stop at understanding current demand. Often, the most important question is: what changes if we change the space itself? Predictive Planning now allows you to model the impact of two new event types, directly in the platform:
- Expansion (Add a Floor): Explore what happens when you bring a new floor online, including impacts to your capacity thresholds and functional zone balance
- Consolidation (Remove a Floor): Model what happens when you take a floor offline. See how reducing supply affects your remaining floors' utilization, capacity balance, and employee experience risk.
Whether you're making the case to add space or proving you can give some back, these scenarios give you the numbers to back it up.
 |
 |
Occupancy Intelligence: Automating Your Operations with Connected Data
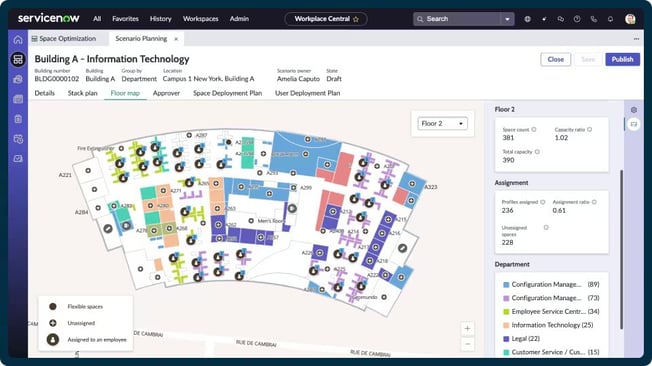
Having accurate occupancy data is the first step. Step two is making sure it reaches the tools and workflows where it drives action. That's why we're spotlighting one of our integrations this month with ServiceNow Workplace Service Delivery (WSD) that allows you to:
- Automate space management: Auto-create bookings when sensors detect occupancy, release no-shows, and free up unused rooms without manual check-ins.
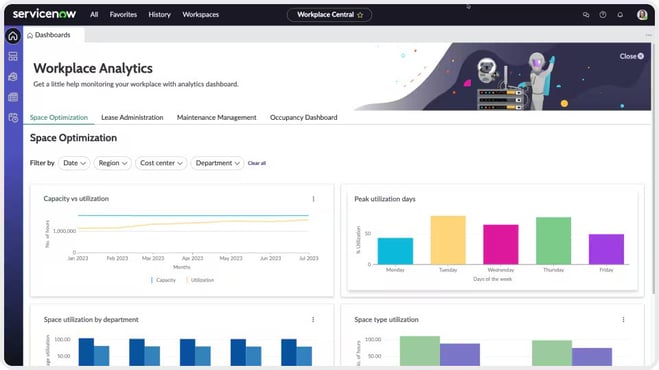
- Get real-time utilization visibility: Push occupancy trends and meeting room metrics directly into ServiceNow dashboards, eliminating tool-switching and CSV exports.
- Trigger cross-departmental workflows: Launch automated cleaning requests, maintenance alerts, and capacity notifications across facilities, IT, and HR based on real-time sensor data.
 |
 |
See How These Updates Work for Your Portfolio
Every update this month serves the same goal: shrinking the distance between insight and action. Less time navigating, more time deciding. Less manual work, more automation. If your team is under pressure to move faster on space plans, then these updates were built for that moment.
Want to learn more about these updates? Book a Demo.