Search for topics or resources
Enter your search below and hit enter or click the search icon.
Make sure your teams never run out of space to work: whenever 80% of your spaces are being used at once, you’ll know an availability shortage is near.
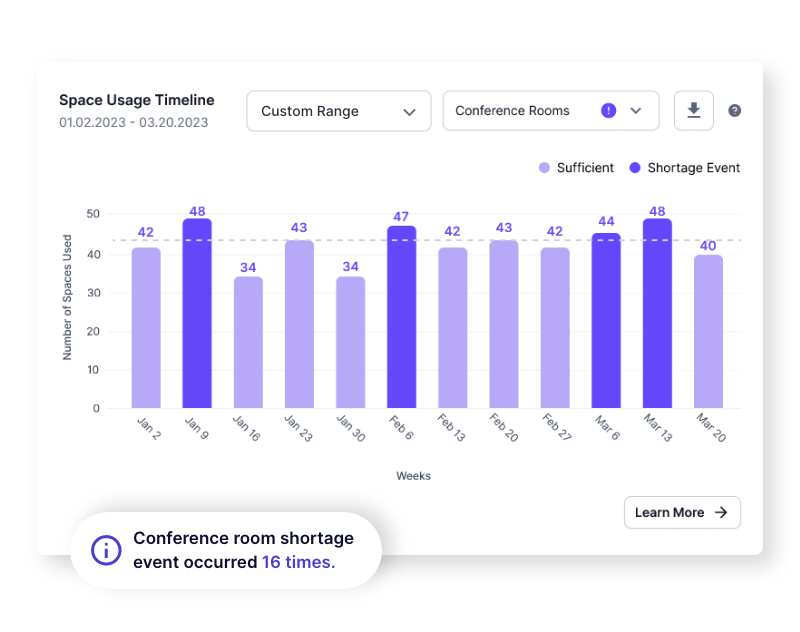
The Space Usage Timeline allows you to uncover “office breaking points,” or specific times of peak usage and shortage. Analyze data across any time horizon all the way down to the hour and filter by building, floor, and space type.
.png?width=800&height=632&name=Sut-2-min%20(1).png)
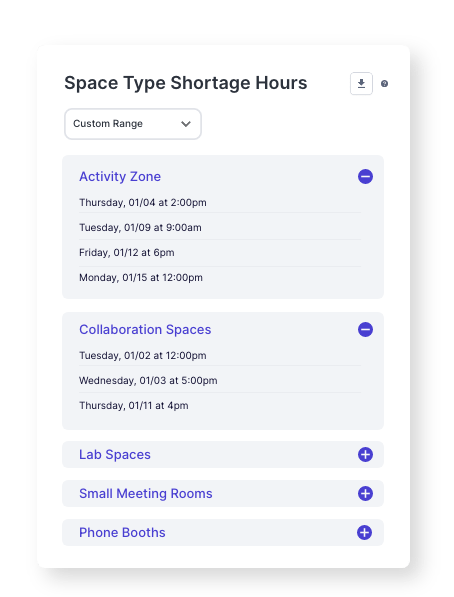
Compare space types, floors, and buildings side by side and easily pinpoint space types that are in high demand, but short supply, so you can make redesign decisions that meet your team's needs and expectations.