



For years, corporate real estate teams have planned space the same way: pull a utilization report once a quarter, build a stacking plan in PowerPoint, and defend the numbers in a meeting where opinions carry as much weight as data.
AI workplace analytics changes that math by turning continuous occupancy signals into planning recommendations you can act on.
This guide walks through how AI workplace analytics powers the four planning decisions CRE leaders own: portfolio right-sizing, space design, occupancy planning, and the stack planning that occupancy planning depends on.
Curious how your portfolio's real occupancy compares before your next planning decision?
See how 200+ global enterprises are reading occupancy data to guide right-sizing, space design, and stack planning decisions in the VergeSense Occupancy Intelligence Index.
Download the Index →
What AI Workplace Analytics Actually Means for CRE Leaders
AI workplace analytics is the layer that turns raw occupancy signals, badge swipes, room-booking data, and WiFi connections, into planning recommendations a real estate team can act on. The analysis moves past reporting that a floor sat at low average utilization last quarter, and models what happens if you consolidate two floors, redesign the space mix, or move a team's location entirely.
The distinction matters because most occupancy tools stop at the dashboard. They tell a CRE leader what happened; they rarely tell you what to do next, or what happens if you act on it. That gap is exactly what keeps portfolio decisions stuck in committee long after the underlying data has already made the case.
This is where AI workplace analytics plays a key role.
Applying AI modeling to workplace data lets leaders run planning scenarios (portfolio right-sizing, space design, occupancy planning, and stack planning) and see a modeled outcome before committing capital or presenting to the board.
The sections below walk through how that plays out across the four planning use cases across a range of portfolio decisions.
The Decision-Making Challenges CRE Leaders Face
Most portfolio decisions still start the same manual way. A real estate leader pulls badge data from one system, reservation data from another, and a survey response from a third, then tries to reconcile all three before a lease renewal deadline. Across a portfolio with multiple buildings, that reconciliation alone can take weeks.
The team doing this work is often a team of one. Lean real estate groups may not have access to a dedicated data analyst, so the person accountable for the recommendation is also the person stitching together spreadsheets from several sources before a board deck is due.
That reality isn't unique to any one company. As Mark Bell, VP of Corporate Real Estate & Mobility at Raymond James, described it: "It's just one tool in your toolbox. I've got badging data, reservation data, anecdotal data, survey data — it's one piece of the bigger puzzle."
Every team has plenty of data. What they lack is a system that turns disconnected sources into one recommendation. This is exactly where AI workplace analytics needs to operate, and where traditional analysis methods are limited.
Why Traditional Analysis Slows Portfolio Decisions
In addition to considerable time, manual analysis costs decisions. A lease renewal deadline arrives before the utilization study is finished, so the team renews on the existing footprint to avoid an under-informed exit. A right-sizing plan stalls in committee because the underlying data can't be defended under a follow-up question from the CFO.
This pattern repeats at the board level too. Executives are increasingly comfortable approving space decisions backed by continuous occupancy intelligence; they're far more hesitant to sign off on a plan built from a six-month-old spreadsheet.
Every week spent reconciling data is a week the actual decision doesn't move forward. A platform that connects live data from multiple sources and runs continuously, rather than a one-time study, removes that lag and gives CRE teams a live, defensible basis for the decision in front of them.
Four Planning Use Cases AI Workplace Analytics Powers
Four planning use cases show up across nearly every CRE portfolio, and AI workplace analytics touches all of them: portfolio right-sizing, space design, occupancy planning, and the stack planning that occupancy planning depends on. Each moves from a business question a leader is already asking to a modeled answer, rather than a guess dressed up as an estimate.
Portfolio Right-Sizing
Manual analysis costs more than time. It costs decisions. A lease renewal deadline arrives before the utilization study is finished, so the team renews on the existing footprint to avoid an under-informed exit. A right-sizing plan stalls in committee because the underlying data can't be defended under a follow-up question from the CFO.
That modeling turns a directional hunch into a specific recommendation a CFO can act on. The output goes past a static utilization report and lands as a consolidation scenario with a cost avoidance figure attached.
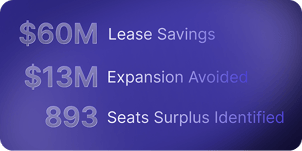
$60M in Lease Cost Avoidance: Fresenius Medical Care's 10-Year Right-Sizing
Fresenius Medical Care used measured utilization data to evaluate its two North American headquarters buildings. One was running at roughly 20% average utilization, data solid enough to support not renewing the lease. The decision avoided $60M in lease costs over 10 years, without a meaningful hit to employee experience.
Space Design
Space design decisions, how much open desking, how many enclosed focus rooms, where a neighborhood boundary sits, are usually made from a standard ratio, then adjusted by feel. Behavioral occupancy data replaces that guesswork by showing which space types are actually oversupplied and which are running short, at the neighborhood level rather than the floor average.
That distinction is what separates a redesign that works from one that just looks right on paper. A floor can average a healthy utilization rate while one space type inside it, an enclosed collaboration room or a focus pod, is consistently full at peak hours. AI workplace analytics surfaces that mismatch and recommends the mix shift that would resolve it, before the redesign gets built.
A design built on assumed ratios and one built on measured behavior can look identical on a floor plan and perform completely differently once people move in. The gap only shows up after the build-out is finished, which is precisely the point at which it's most expensive to fix.
Occupancy Planning
Occupancy planning is where AI workplace analytics shifts from describing the past to forecasting what's next. Predictive analytics models demand and peak attendance patterns ahead of time, so a team can plan capacity before a floor visibly runs over and before employees notice.
Stack planning, deciding which teams occupy which floors, is a natural extension of that forecast. AI workplace analytics moves past headcount as the assignment rule and models the way teams actually share space.
Predictive Planning does this through Capacity Pooling: grouping segments of a portfolio, floors, buildings, or individual neighborhoods, into shared capacity pools, evaluating spaces that share demand together while isolating self-contained neighborhoods to see where each one specifically breaks.
That's the difference between restacking on assumptions and restacking on measured adjacency and utilization: two floors that share foot traffic between teams get planned as one pool, while a self-contained floor gets modeled on its own.
How VergeSense Turns Workplace Data Into Planning Decisions
The planning engine behind all four use cases above is Predictive Planning, the capability that turns behavioral data into modeled scenarios rather than static reports. It's powered by the Large Spatial Model (LSM), trained on 250M+ sq ft of measured workplace data collected over 8 years across real portfolios.
The "AI" in AI workplace analytics is a modeling claim before it's anything else. The LSM runs 1,000+ Monte Carlo simulations per scenario, producing a probabilistic view of how a space is most likely to perform rather than a single-point estimate.
That same modeling defines an Employee Experience Risk metric, quantifying the percentage of employees likely unable to find their desired space type at a given attendance level and floor plan, and sets sustainable capacity boundaries per floor, a realistic operating range grounded in how people actually show up rather than a theoretical maximum.
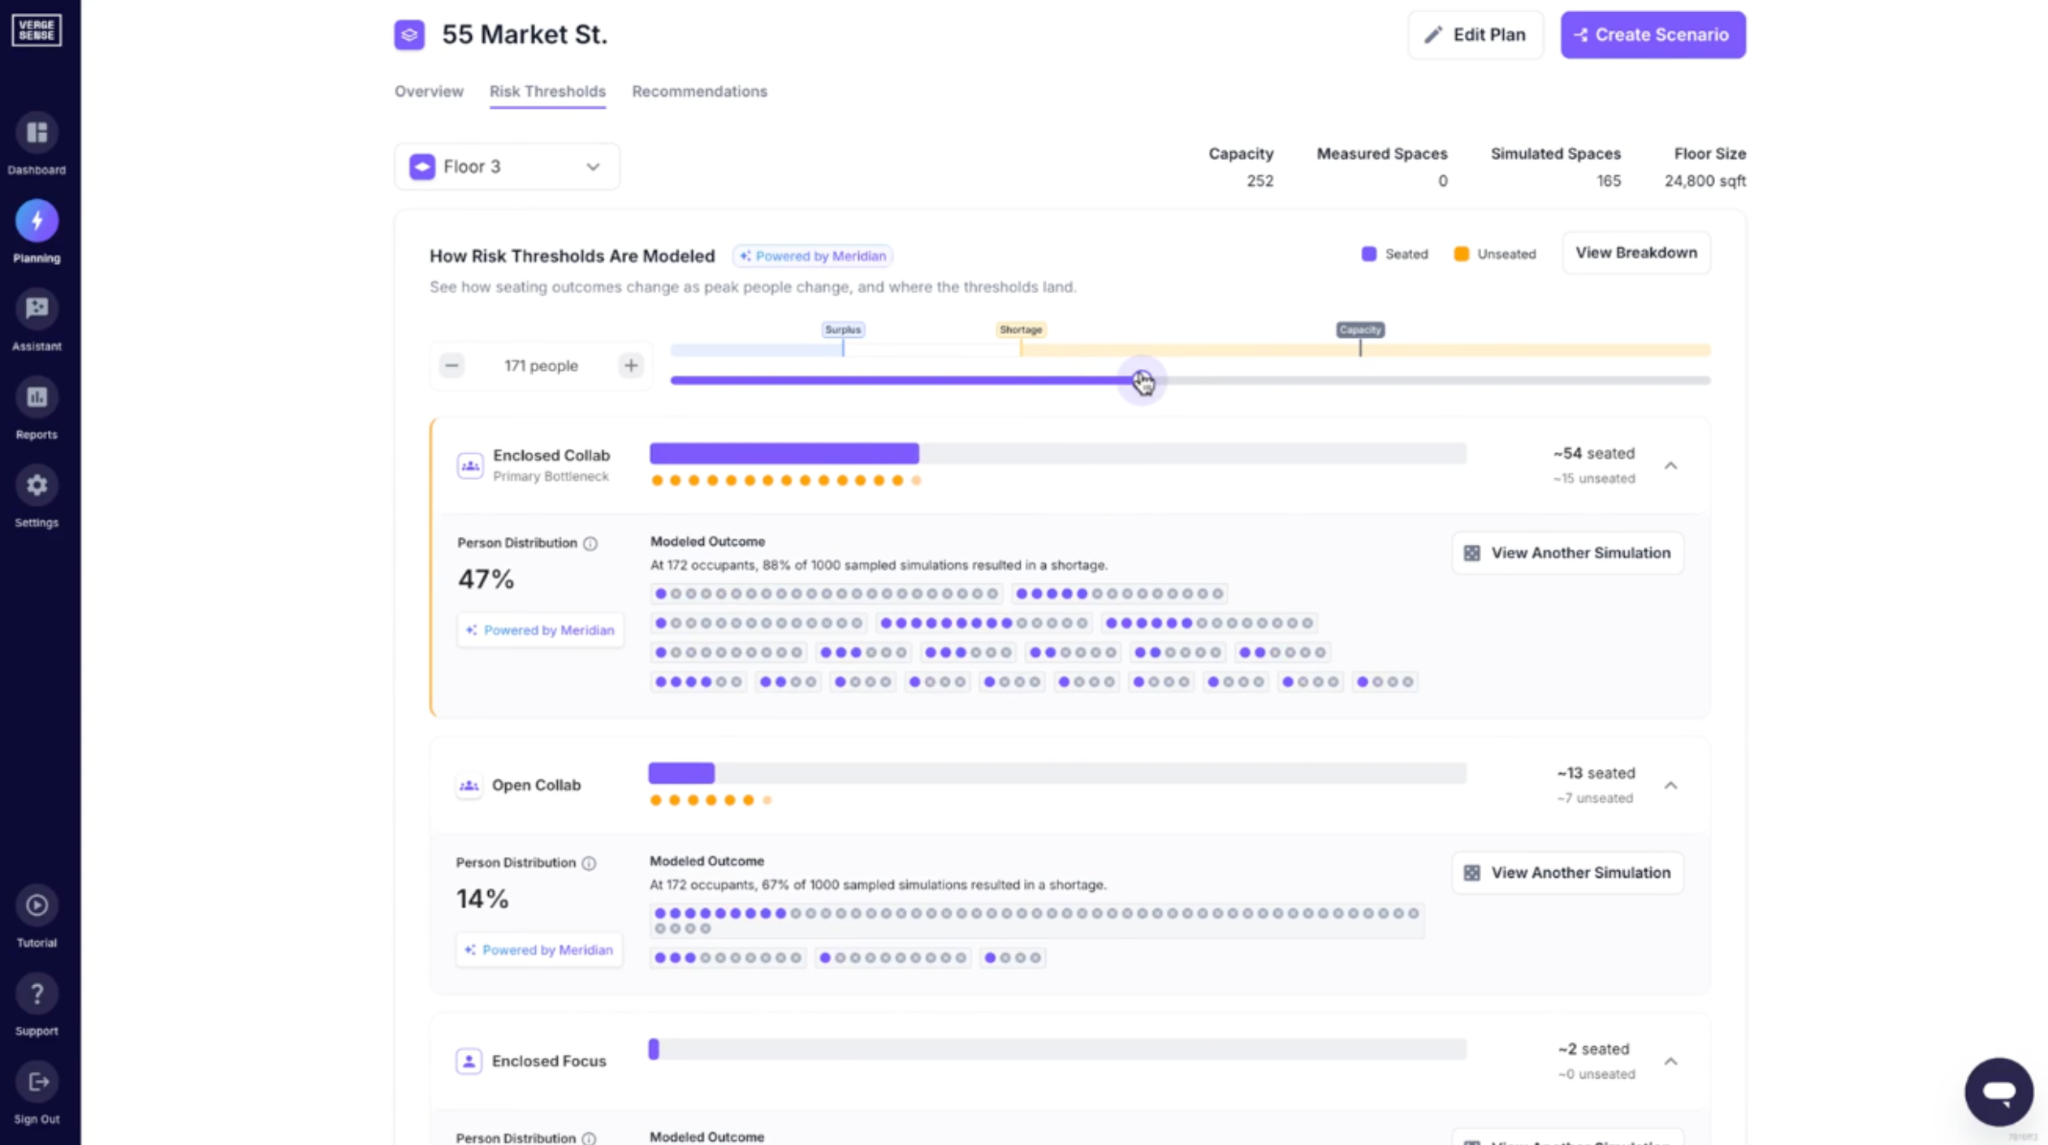
That probabilistic layer is what lets a CRE leader answer a specific "what if" with a modeled number instead of a guess: what happens if Tuesdays jump 20%, or a headquarters consolidates two buildings into one. It's the same modeling foundation behind VergeSense's broader Space Planning resources for CRE leaders evaluating AI for real estate.
How to Get Started With AI Workplace Analytics
Getting started doesn't require ripping out existing systems. Start by auditing the data sources that already exist, badge access, room booking, WiFi, videoconferencing data, sensors, and understanding which ones are reliable enough to build a plan on.
Next, define the planning questions that actually matter to your portfolio this year: a lease renewal, a headquarters consolidation, a redesign, or a restack. Being specific about the decision keeps the analysis from turning into another dashboard exercise.
Finally, choose an AI approach that outputs a decision on the other end of the chart. The measure of a good space optimization platform is whether it tells you what to do next and lets you test the alternative before you commit. Benchmarking your own portfolio against how similar organizations are planning is a useful gut check before that first decision.
Ready to see what AI workplace analytics looks like for your portfolio?
VergeSense models right-sizing, redesign, and restack decisions against measured occupancy.
Book a Demo →
FAQs About AI Workplace Analytics
How Is AI Workplace Analytics Different From a Traditional Occupancy Dashboard?
AI workplace analytics differs from a traditional occupancy dashboard by modeling what happens next. A dashboard reports what already happened: utilization by floor, booking rates, badge counts. AI workplace analytics goes further and models what a consolidation, redesign, or team move would do before you commit to it, so the output is a recommendation you can act on.
What Data Sources Does AI Workplace Analytics Pull From?
AI workplace analytics pulls from badge access data, room-booking systems, WiFi connections, videoconferencing data, and occupancy sensors, then layers AI modeling on top. The more sources feeding the model, the more confidently it can quantify actual utilization and forecast demand across a multi-building portfolio.
How Does AI Workplace Analytics Support Lease Renewal Decisions?
AI workplace analytics supports lease renewal decisions by replacing a point-in-time observation study with continuous utilization data, so a team can see whether a building justifies its footprint before a renewal deadline arrives. That visibility lets leaders defend a renewal or exit decision with current data instead of a stale study.
Is Workplace Occupancy Data Accurate Enough to Plan a Portfolio On?
Workplace occupancy data is accurate enough to plan a portfolio on when it's measured rather than self-reported. Sensor-based occupancy data reaches roughly 95% accuracy at the area level, compared to about 85% for WiFi-based data at the floor level, enough to support lease, design, and stack planning decisions with confidence.

.jpg)