
Meetings take up a sizable percentage of time within the corporate ecosystem. According to a study conducted by Atlassian, the average employee attends 62 meetings on a monthly basis, and as employees start to re-integrate the physical space into their work, face-to-face meetings will return.
In-person meetings will become increasingly important given our long-time distance apart, and will be especially helpful for strategic conversations that require a sense of relationship and connection for driving innovation or addressing sensitive topics.
These dialogues define the culture and strategic goals / vision of the company. Historically, meetings have taken place in many forms – formally and informally – across a company’s physical asset, requiring a number of bespoke amenities (whiteboards, teleconferencing tools, outlets, etc). As the workforce starts to re-enter the workplace, leaders will need better tools to understand how efficiently and effectively the space caters to these dynamic conversations.
That’s where our new dashboard in the VergeSense Workplace Analytics Platform comes into play. VergeSense Scheduled Meeting Analytics Dashboard empowers leaders with real-time analytics to make smarter workplace decisions in three key steps.
1. Understanding Meeting Room Utilization Trends
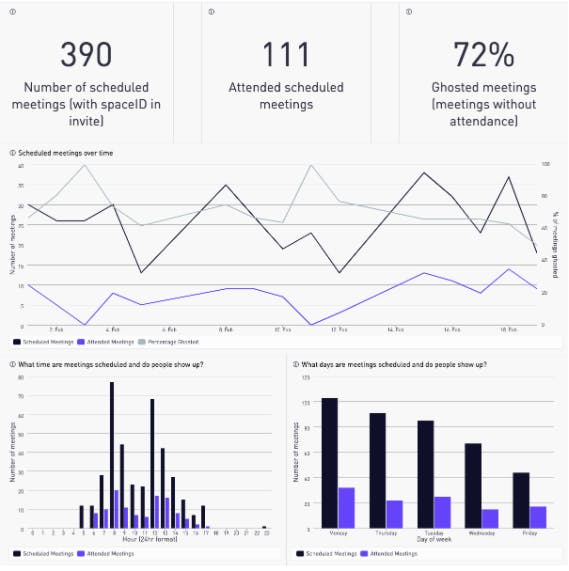
Leveraging our analytical dashboard can unlock a wealth of insight around how the space is being leveraged for meetings and to what extent.
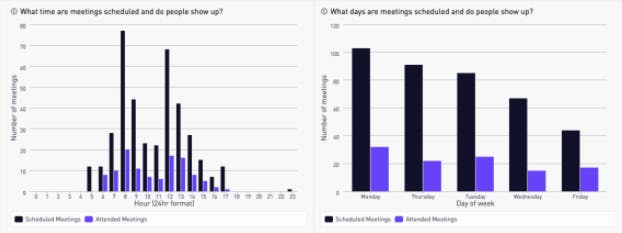
By learning meeting room habits, leaders can understand the amount of meetings scheduled and the frequency in which employees attend meetings over time. Eventually they will have visibility into the correlation between the number of people invited compared to the number attended.
Our robust analytical tool is ready to integrate with leading meeting management and scheduling tools such as TEEM, Robin, MS Outlook 365 & Google Calendar to provide in-depth utilization metrics.
The user-friendly dashboards are empowered with critical KPIs including rooms booked, room capacity and meeting times to provide insight around space utilization and behavior.
2. Determine Ideal Conference Room Space Mix
Based on an article in WSJ, architecture and design firm HOK surveyed 11 firms and found that conference rooms in general are too big: 73% of meetings involve only two to four people, but 53% of conference-room space is built for meetings of seven or more.
Utilizing our Meeting Analytics Dashboard, leaders can start to understand the efficiency with which space is being used and reassess the overall real estate portfolio accordingly.
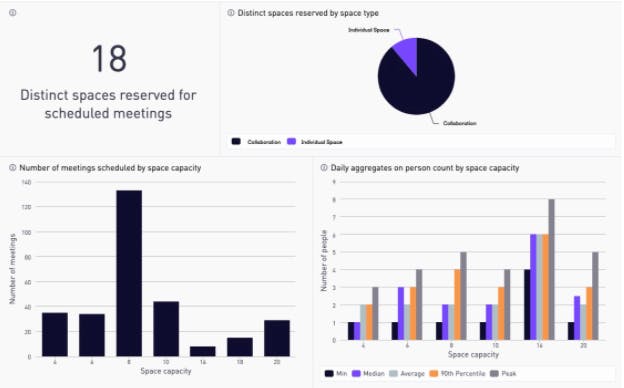
Comparing the meeting size to the capacity of the room that was booked will provide tactical insight to the ideal space mix for the intended users.
3. Leverage Analytics Data to Enhance Employee Productivity
As employees start to re-enter the physical workplace, new behaviors and patterns will emerge over time. Continuously validating the effectiveness of the space design will improve the employee experience within the office, but anchoring into the data at a meeting level granularity will provide efficacy in terms of employee productivity.
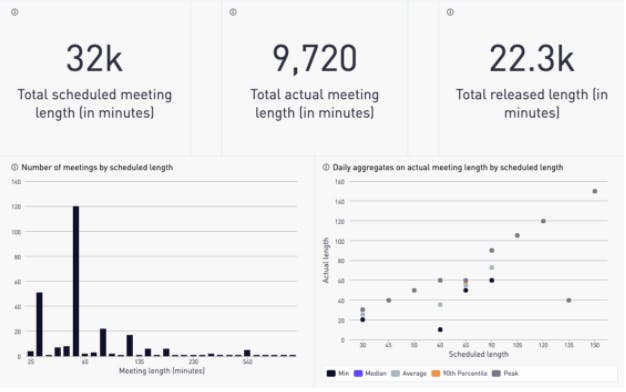
Understanding the average length or duration of meetings will also provide additional transparency around the habits behind the organizers. Depending on the average time spent across meetings, certain scheduled conferences may be able to be cut short, releasing the space for additional users. For example, if a meeting is scheduled for 1 hour, and released within 45 minutes, opportunity exists for another group to have a quick meeting prior to the next scheduled.
According to TEEM (now iOffice), 34% of scheduled meetings end up as no-shows, also known as ghost meetings. By utilizing our analytics tool, the meeting management data coupled with our sensors can identify no-shows and auto-release the room for booking.
Ultimately, this will not only enhance employee productivity, but also alleviate the overall frustration and concern around being unable to book ad-hoc meetings, reducing meeting room inefficiencies & potential wasted hours.
How the VergeSense Meeting Analytics Dashboard Can Help
The Scheduled Meeting Analytics Dashboard enables workplace leaders to use the data collected to take action on how spaces are used for scheduled meetings — leaving them better equipped and prepared to make changes to their workspaces to maximize productivity and efficiency.
Our dashboards are always evolving to provide you the best insight data can offer. We invite you to book a one-on-one demo with one of our workplace specialists to see the power of the VergeSense Workplace Analytics Platform.