Search for topics or resources
Enter your search below and hit enter or click the search icon.
The world’s most comprehensive view of how offices actually worked this year.
The new Index is here, powered by 200M+ sq. ft. of real workplace behavior across 250,000 spaces and 200+ global enterprises. This edition uncovers the hidden patterns driving today’s workplace performance and reveals why offices feel full long before they hit capacity.
The volatility averages hide — and why planning from the mean no longer works
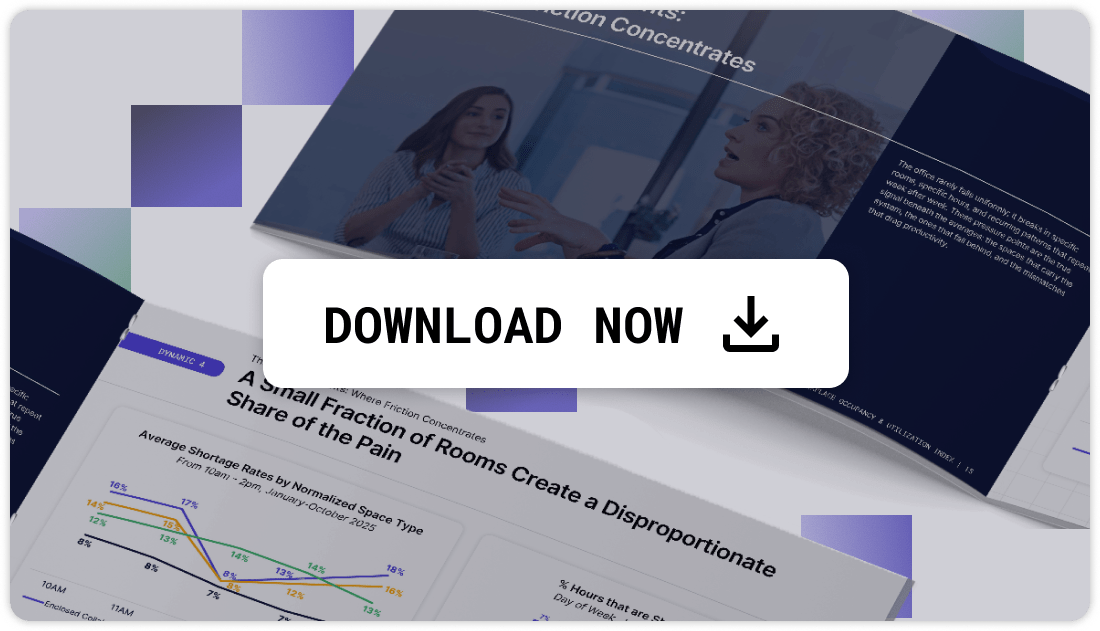
Where friction really concentrates — and which rooms absorb the most pressure
How hybrid work is reshaping demand across enclosed, open, and collaborative spaces
The six workplace dynamics transforming space planning for 2025
Regional and industry-specific rhythms every leader needs to understand now
Workplace behavior is changing faster than traditional planning models can keep up. The 2025 Index gives you clear, evidence-backed signals to guide portfolio decisions with accuracy, speed, and confidence.
If you’re responsible for workplace strategy, real estate planning, space allocation, or portfolio right-sizing, this is the benchmark you can’t afford to skip.
Get the data. See the patterns. Plan with precision.

Uncover the days and hours when focus rooms, enclosed collaboration spaces, and open collaboration zones hit capacity — and learn why those pressure points occur so you can anticipate friction before it hits.

Identify which space types carry the workload and which ones consistently fall short. See how patterns shift across industries so you can design environments that support teams at the exact moments they need the office most.
See how Finance surges, Healthcare spikes, Industrial swings in cycles, and why understanding your sector’s unique cadence is now essential for smarter planning.